Red Snapper Management Measures - SAFMC.net
Red Snapper Management Measures - SAFMC.net
Red Snapper Management Measures - SAFMC.net

Create successful ePaper yourself
Turn your PDF publications into a flip-book with our unique Google optimized e-Paper software.
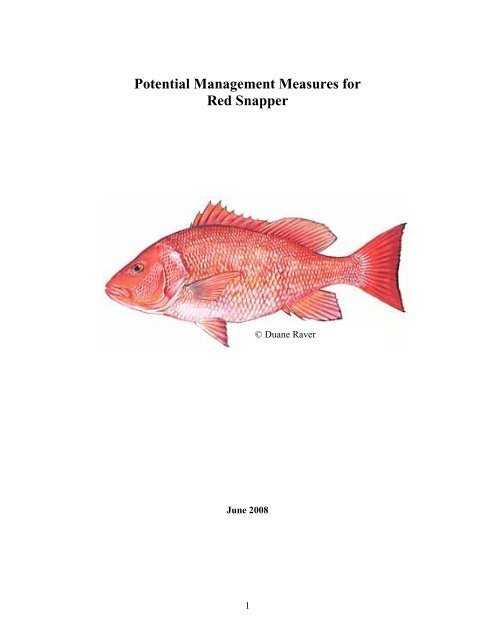
Potential <strong>Management</strong> <strong>Measures</strong> for<br />
<strong>Red</strong> <strong>Snapper</strong><br />
© Duane Raver<br />
June 2008<br />
1
Summary<br />
The base run of the age-structured assessment model indicated that the stock is<br />
overfished (SSB2006/SSB MSY = 0.037) and that overfishing is occurring (F 2006 /F MSY =<br />
7.513). These results were invariant to the 31 different configurations used in sensitivity<br />
runs and retrospective analyses. In addition, the same qualitative findings resulted from<br />
the age-aggregated surplus production model and its various sensitivity runs (SEDAR 15<br />
2008).<br />
Estimates of annual biomass have been well below B MSY since the mid-1960s, with<br />
possibly some small amount of recovery since implementation of current size limits in<br />
1992. The estimate of F 2006 /F MSY does not indicate severe overfishing in the terminal<br />
year; however, estimates of annual F have exceeded F MSY substantially and regularly<br />
over the last half century. Sensitivity analyses indicated that qualitative results were<br />
invariant to assumptions about starting biomass and discards.<br />
2
TABLE OF CONTENTS (click on item below to move to section)<br />
1 <strong>Red</strong> <strong>Snapper</strong> Landings ................................................................................................ 4<br />
1.1 <strong>Red</strong> <strong>Snapper</strong> Commercial Landings (lbs gutted weight) From Assessment....... 4<br />
1.2 <strong>Red</strong> <strong>Snapper</strong> Recreational Landings (lbs gutted weight) From Assessment ...... 5<br />
1.3 <strong>Red</strong> <strong>Snapper</strong> Landings (ALS), MRFSS, Headboat............................................. 7<br />
1.4 <strong>Red</strong> <strong>Snapper</strong> Recreational Landings in Number................................................. 7<br />
1.5 <strong>Red</strong> snapper Landings by State........................................................................... 9<br />
1.6 <strong>Red</strong> <strong>Snapper</strong> Landings by Month and State...................................................... 10<br />
1.6.1 Commercial 2001-2006 ............................................................................ 10<br />
1.6.2 Commercial – By Year ............................................................................. 11<br />
1.6.3 Headboat 2001-2006................................................................................. 13<br />
1.6.4 Headboat – By Year.................................................................................. 14<br />
1.6.5 MRFSS 2001-2006 ................................................................................... 16<br />
1.6.6 MRFSS – By Year .................................................................................... 18<br />
1.7 <strong>Red</strong> <strong>Snapper</strong> Commercial Percentage............................................................... 21<br />
1.8 <strong>Red</strong> <strong>Snapper</strong> Recreational Percentage .............................................................. 22<br />
2 Monthly catch and reduction provided by seasonal closure ..................................... 23<br />
2.1 Commercial....................................................................................................... 23<br />
2.1.1 Effectiveness of Commercial Closure ...................................................... 24<br />
2.1.2 Monthly reduction in total removals from commercial seasonal closure. 26<br />
2.2 Recreational ...................................................................................................... 27<br />
2.2.1 Headboat ................................................................................................... 27<br />
2.2.2 Monthly reduction in total removals from headboat seasonal closure ..... 29<br />
2.2.3 MRFSS...................................................................................................... 31<br />
2.2.4 Monthly reduction in total removals from MRFSS seasonal closure....... 33<br />
2.3 <strong>Red</strong>uction in total removals from prohibition in catch of red snapper ............. 33<br />
2.4 Locations where red snapper are caught........................................................... 37<br />
2.4.1 Commercial............................................................................................... 37<br />
2.4.2 Headboat ................................................................................................... 38<br />
2.4.3 MRFSS...................................................................................................... 39<br />
3 Commercial Trip Limit Analysis.............................................................................. 40<br />
4 SPECIES DESCRIPTIONS OF RED SNAPPER.................................................................... 41<br />
5 References................................................................................................................. 42<br />
3
1 <strong>Red</strong> <strong>Snapper</strong> Landings<br />
1.1 <strong>Red</strong> <strong>Snapper</strong> Commercial Landings (lbs gutted weight) From Assessment<br />
Table 1. Table 3.2 from SEDAR 15 2008 assessment.<br />
Year Florida GA-NC Total<br />
1927 53,153 58,584 111,737<br />
1928 42,342 21,672 64,014<br />
1929 17,117 43,619 60,736<br />
1930 30,631 31,657 62,287<br />
1931 100,901 1,852 102,753<br />
1932 44,144 0 44,144<br />
1933 90,541 0 90,541<br />
1934 136,937 0 136,937<br />
1935 131,532 0 131,532<br />
1936 126,126 0 126,126<br />
1937 189,189 0 189,189<br />
1,000,000<br />
1938 105,405 926 106,331<br />
900,000<br />
1939 86,486 1,852 88,338<br />
800,000<br />
1940 12,613 0 12,613<br />
700,000<br />
1941 0 0 0<br />
600,000<br />
1942 0 0 0<br />
500,000<br />
1943 0 0 0<br />
400,000<br />
1944 0 0 0<br />
300,000<br />
1945 221,622 3,704 225,325<br />
200,000<br />
1946 241,802 3,863 245,665<br />
100,000<br />
1947 261,982 4,022 266,004<br />
0<br />
1948 282,162 4,181 286,344<br />
1949 302,342 4,341 306,683<br />
Year<br />
1950 322,523 4,500 327,023<br />
1951 459,459 6,944 466,404<br />
1952 345,946 4,630 350,576<br />
1953 362,162 1,802 363,964<br />
1954 536,937 2,703 539,640<br />
1955 448,649 0 448,649<br />
1956 308,108 131,541 439,649<br />
1957 579,279 209,326 788,605<br />
1958 530,631 25,648 556,279<br />
1959 566,667 30,459 597,126<br />
1960 600,901 9,285 610,186<br />
1961 610,811 109,866 720,676<br />
1962 529,584 9,155 538,739<br />
1963 406,379 3,839 410,218<br />
1964 446,717 8,203 454,920<br />
1965 519,844 14,670 534,515<br />
1966 591,835 10,090 601,925<br />
1967 733,301 55,863 789,164<br />
1968 789,871 88,235 878,106<br />
1969 544,517 27,023 571,540<br />
1970 498,012 25,034 523,046<br />
4<br />
Pounds (gw)<br />
<strong>Red</strong> <strong>Snapper</strong> Commercial Landings<br />
1920 1940 1960 1980 2000 2020<br />
Florida<br />
GA-NC<br />
Total
Year Florida GA-NC Total<br />
1971 391,932 56,029 447,962<br />
1972 326,597 60,947 387,544<br />
1973 284,717 33,488 318,205<br />
1974 469,280 50,080 519,360<br />
1975 576,252 32,654 608,906<br />
1976 426,995 85,044 512,038<br />
1977 409,869 131,921 541,790<br />
1978 312,475 197,387 509,862<br />
1979 206,477 149,680 356,157<br />
1980 192,773 137,314 330,087<br />
1981 166,062 158,669 324,731<br />
1982 134,104 133,455 267,559<br />
1983 141,099 130,138 271,237<br />
1984 118,516 98,282 216,799<br />
1985 127,659 83,071 210,730<br />
1986 112,243 75,513 187,755<br />
1987 105,465 56,591 162,056<br />
1988 84,629 57,837 142,465<br />
1989 98,692 129,212 227,904<br />
1990 89,469 100,755 190,224<br />
1991 61,923 60,329 122,252<br />
1992 53,534 37,168 90,702<br />
1993 74,326 124,096 198,422<br />
1994 73,633 102,777 176,410<br />
1995 96,745 66,246 162,991<br />
1996 83,144 44,220 127,364<br />
1997 73,618 25,884 99,501<br />
1998 57,436 23,699 81,135<br />
1999 44,352 38,750 83,102<br />
2000 63,706 30,374 94,080<br />
2001 104,467 73,128 177,595<br />
2002 83,596 86,353 169,949<br />
2003 66,078 59,689 125,768<br />
2004 90,741 65,194 155,935<br />
2005 65,890 50,475 116,366<br />
2006 51,147 26,653 77,800<br />
Number (1000s)<br />
Recreational Catch<br />
600<br />
500<br />
400<br />
300<br />
200<br />
100<br />
0<br />
1960 1970 1980 1990 2000<br />
Years<br />
HB Landed<br />
HB Discards<br />
A+B1<br />
B2<br />
1.2 <strong>Red</strong> <strong>Snapper</strong> Recreational Landings (lbs gutted weight) From Assessment<br />
Table 2. <strong>Red</strong> snapper recreational landings from SEDAR 17 assessment.<br />
Number of fish in 1000's<br />
Landings PSE Discards PSE Landings + Discards<br />
Year Headboat MRFSS total MRFSS Headboat MRFSS total MRFSS Headboat MRFSS total<br />
1962* 8.502 64.8 73.305 25.2 3.1 23.63 26.734 30 11.602 88.437 100.039<br />
1963* 9.033 68.85 77.886 25.2 3.29 25.11 28.405 30 12.327 93.964 106.291<br />
1964* 9.564 72.9 82.468 25.2 3.49 26.59 30.076 30 13.052 99.491 112.544<br />
1965* 10.096 76.95 87.049 25.2 3.68 28.06 31.747 30 13.777 105.019 118.796<br />
1966* 10.627 81 91.631 25.2 3.88 29.54 33.418 30 14.503 110.546 125.049<br />
1967* 11.158 85.05 96.212 25.2 4.07 31.02 35.089 30 15.228 116.073 131.301<br />
5
Number of fish in 1000's<br />
Landings PSE Discards PSE Landings + Discards<br />
Year Headboat MRFSS total MRFSS Headboat MRFSS total MRFSS Headboat MRFSS total<br />
1968* 11.69 89.1 100.794 25.2 4.26 32.5 36.759 30 15.953 121.601 137.554<br />
1969* 12.221 93.15 105.376 25.2 4.46 33.97 38.43 30 16.678 127.128 143.806<br />
1970* 12.752 97.2 109.957 25.2 4.65 35.45 40.101 30 17.403 132.655 150.058<br />
1971* 13.284 101.26 114.539 25.2 4.84 36.93 41.772 30 18.128 138.183 156.311<br />
1972* 11.98 105.31 117.285 25.2 4.37 38.4 42.774 30 16.349 143.71 160.059<br />
1973* 15.776 109.36 125.131 25.2 5.75 39.88 45.635 30 21.529 149.237 170.767<br />
1974* 13.689 113.41 127.095 25.2 4.99 41.36 46.351 30 18.681 154.765 173.446<br />
1975* 17.505 117.46 134.961 25.2 6.38 42.84 49.22 30 23.889 160.292 184.181<br />
1976* 19.387 121.51 140.893 25.2 7.07 44.31 51.384 30 26.457 165.819 192.277<br />
1977* 12.379 125.56 137.935 25.2 4.51 45.79 50.305 30 16.894 171.346 188.24<br />
1978* 12.954 129.61 142.56 25.2 4.72 47.27 51.992 30 17.678 176.874 194.552<br />
1979* 9.565 133.66 143.222 25.2 3.49 48.74 52.233 30 13.053 182.401 195.454<br />
1980* 14.511 137.71 152.218 25.2 5.29 50.22 55.514 30 19.803 187.928 207.732<br />
1981 35.719 186.52 222.234 25.1 0.38 2 2.383 100 36.102 188.515 224.617<br />
1982 19.553 60.37 79.926 30.6 0 0 0 0 19.553 60.373 79.926<br />
1983 30.698 165.96 196.66 19.8 7.41 40.04 47.451 38 38.105 206.006 244.111<br />
1984 31.146 412.03 443.174 17.9 9.62 127.31 136.931 29.5 40.769 539.336 580.105<br />
1985 50.336 527.14 577.475 19 8.62 90.29 98.912 43.9 58.958 617.429 676.387<br />
1986 16.625 180.5 197.128 32.2 0 0 0 0 16.625 180.503 197.128<br />
1987 24.996 63.25 88.247 19.7 42.18 106.73 148.906 57.8 67.174 169.979 237.153<br />
1988 36.527 128.99 165.518 28.3 13.7 48.37 62.071 47.3 50.225 177.364 227.589<br />
1989 23.453 149.92 173.368 19.9 3.13 20.04 23.173 41.9 26.588 169.953 196.541<br />
1990 20.919 14.93 35.846 30.6 0 0 0 0 20.919 14.927 35.846<br />
1991 13.857 46.28 60.133 33.1 10.78 35.99 46.771 51.5 24.635 82.269 106.904<br />
1992 5.301 81.28 86.578 18.5 1.92 29.45 31.371 29.4 7.222 110.727 117.949<br />
1993 7.347 16.32 23.67 21.8 31.74 70.51 102.242 28.4 39.082 86.83 125.912<br />
1994 8.225 27.35 35.578 25.9 19.22 63.91 83.129 28.9 27.443 91.264 118.707<br />
1995 8.826 14.01 22.837 29.7 32.05 50.87 82.918 20.2 40.872 64.883 105.755<br />
1996 5.543 14.36 19.899 41.2 7.69 19.93 27.618 38 13.236 34.281 47.517<br />
1997 5.77 34.33 40.097 48.5 2.31 13.74 16.052 26.9 8.08 48.069 56.149<br />
1998 4.741 16.9 21.644 24 7.7 27.46 35.158 32.5 12.442 44.36 56.802<br />
1999 6.836 58.18 65.017 20.9 21.11 179.67 200.775 15.9 27.946 237.846 265.792<br />
2000 8.437 73.77 82.211 20.3 29.67 259.42 289.089 14.8 38.105 333.195 371.3<br />
2001 12.028 50.81 62.842 16.6 49.44 208.89 258.329 13.8 61.472 259.699 321.171<br />
2002 12.931 53.29 66.218 15.8 31.87 131.32 163.19 18.2 44.799 184.609 229.408<br />
2003 5.706 35.66 41.367 16.5 25.47 159.18 184.646 16.2 31.175 194.838 226.013<br />
2004 10.842 38.89 49.728 14.9 52.83 189.48 242.306 14.3 63.671 228.363 292.034<br />
2005 8.907 33.71 42.615 18.2 32.52 123.06 155.576 13.4 41.424 156.767 198.191<br />
2006 5.945 27.02 32.962 18.8 30.32 137.8 168.126 18.2 36.268 164.82 201.088<br />
6
1.3 <strong>Red</strong> <strong>Snapper</strong> Landings (ALS), MRFSS, Headboat<br />
Table 3. <strong>Red</strong> snapper commercial landings from ALS (includes all of Monroe County);<br />
MRFSS Web site; Headboat survey. Data do not include dead discards and MRFSS data<br />
are A+B1; weight not converted from numbers. Landings converted to gutted weight<br />
using factor of 1.11.<br />
Year ALS HB MRFSS<br />
1986 202,468 48,991 102,264<br />
1987 176,866 73,728 120,427<br />
1988 159,443 117,178 202,698<br />
1989 241,755 63,779 242,157<br />
1990 200,742 59,176 103,875<br />
1991 132,881 64,891 118,480<br />
1992 91,926 26,050 556,498<br />
1993 204,283 38,484 127,557<br />
1994 182,043 38,753 180,644<br />
1995 166,342 51,778 59,463<br />
1996 129,789 41,652 95,682<br />
1997 102,111 46,130 80,095<br />
1998 81,463 24,187 103,570<br />
1999 85,786 39,241 152,641<br />
2000 95,214 44,506 450,378<br />
2001 178,579 61,607 318,580<br />
2002 171,686 63,780 352,170<br />
2003 146,579 37,255 233,616<br />
2004 154,419 72,380 264,790<br />
2005 118,924 52,878 236,294<br />
2006 81,000 37,325 216,393<br />
2007 91,475 0 266,008<br />
1.4 <strong>Red</strong> <strong>Snapper</strong> Recreational Landings in Number<br />
Table 4. <strong>Red</strong> <strong>Snapper</strong> Landings – Pounds Gutted Weight. Source: MRFSS Web site;<br />
Headboat survey. Data do not include dead discards and MRFSS data are A+B1; weight<br />
not converted from numbers.<br />
MRFSS<br />
Year HB A+B1 PSE Total<br />
1986 16,625 113,513 27.3 130,138<br />
1987 24,996 133,674 20 158,670<br />
1988 36,527 224,995 23.4 261,522<br />
1989 23,453 268,794 28.2 292,247<br />
1990 20,919 115,301 7.9 136,220<br />
1991 13,857 131,513 34.2 145,370<br />
1992 5,301 617,713 38.3 623,014<br />
1993 7,347 141,588 26.6 148,935<br />
1994 8,225 200,515 35.9 208,740<br />
1995 8,826 66,004 28 74,830<br />
1996 5,543 106,207 50.2 111,750<br />
7
Year HB<br />
MRFSS<br />
A+B1 PSE Total<br />
1997 5,770 88,905 43.6 94,675<br />
1998 4,741 114,963 31.7 119,704<br />
1999 6,836 169,432 17.9 176,268<br />
2000 8,437 499,920 23.9 508,357<br />
2001 12,028 353,624 18.8 365,652<br />
2002 12,931 390,909 16.9 403,840<br />
2003 5,706 259,314 18 265,020<br />
2004 10,842 293,917 15.3 304,759<br />
2005 8,907 262,286 17 271,193<br />
2006 5,945 240,196 24.4 246,141<br />
2007 295,269 29.7 295,269<br />
Table 5. <strong>Red</strong> <strong>Snapper</strong> Landings – MRFSS Discards (B2). Source: MRFSS Web site.<br />
MRFSS<br />
Year B2s PSE<br />
1986 0 0<br />
1987 106,728 57.8<br />
1988 100,493 54.2<br />
1989 26,738 40.1<br />
1990 2,498 100<br />
1991 44,619 43.8<br />
1992 34,712 26.4<br />
1993 70,507 28.4<br />
1994 67,266 27.7<br />
1995 54,796 19.4<br />
1996 19,925 38<br />
1997 15,011 26<br />
1998 28,767 31.2<br />
1999 182,436 15.7<br />
2000 269,489 14.5<br />
2001 210,793 13.7<br />
2002 131,322 18.2<br />
2003 160,229 16.1<br />
2004 203,273 13.6<br />
2005 125,739 13.3<br />
2006 134,692 18.5<br />
2007 448,144 12.7<br />
8
1.5 <strong>Red</strong> snapper Landings by State<br />
Table 6. Commercial landings (pounds) of red snapper by state, 2001-2006. Source<br />
ALS. Monroe County not divided into Atlantic and Gulf.<br />
State 2001-2006 Avg ww Avg GW Percent<br />
FL 518,166 86,361 77,803 55.06%<br />
Monroe 25,335 4,223 3,804 2.69%<br />
Georgia 108,047 18,008 16,223 11.48%<br />
NC 80,616 13,436 12,105 8.57%<br />
SC 208,902 34,817 31,367 22.20%<br />
Table 7. Headboat landings (pounds) of red snapper by state, 2001-2006.<br />
State 2001-2006 Avg ww Avg GW Percent<br />
South FL 11,805 1,968 1,773 3.27%<br />
GA & NFL 223,507 37,251 33,560 61.91%<br />
SC 84,416 14,069 12,675 23.38%<br />
NC 41,272 6,879 6,197 11.43%<br />
Table 8. MRFSS landings (pounds) of red snapper by state, 2001-2006.<br />
2001-<br />
State 2006 Avg ww Avg GW Percent<br />
FL 1,563,204 260,534 234,715 86.83%<br />
Georgia 99,494 16,582 14,939 5.53%<br />
SC 69,668 11,611 10,461 3.87%<br />
NC 67,880 11,313 10,192 3.77%<br />
Table 9. MRFFS landings (number A+B1) of red snapper by state, 2001-2006.<br />
2001-<br />
State 2006 Avg ww Avg GW Percent<br />
FL 206,489 34,415 31,004 86.05%<br />
Georgia 10,591 1,765 1,590 4.41%<br />
SC 9,526 1,588 1,430 3.97%<br />
NC 13,363 2,227 2,006 5.57%<br />
Table 10. MRFSS number of red snapper released alive (B2) among states, 2001-2006.<br />
MRFSS 2001-2006 avg percent<br />
FL 623,153 124,631 89.62%<br />
GA 5,878 1,176 0.85%<br />
SC 24,128 4,826 3.47%<br />
NC 42,161 8,432 6.06%<br />
Table 11. Percentage of red snapper MRFSS B2s by state. Average 2001-2006.<br />
MRFSS A+B1 B2 A+B1+B2 % B2<br />
FL 29,396 124,631 154,027 80.92%<br />
GA 1,089 1,176 2,265 56.60%<br />
SC 2,136 4,826 6,962 62.40%<br />
NC 12,849 8,432 21,281 40.50%<br />
Total 45,470 139,065 184,535 75.36%<br />
9
1.6 <strong>Red</strong> <strong>Snapper</strong> Landings by Month and State<br />
1.6.1 Commercial 2001-2006<br />
Table 12. Average red snapper commercial landings 2001-2006 (lbs gutted weight) by<br />
state and month. Includes Monroe County South Atlantic landings.<br />
Month Total FL GA SC NC<br />
1 12,023 7,296 1,254 2,627 847<br />
2 12,250 7,485 1,979 2,121 665<br />
3 13,175 8,542 1,235 2,370 1,029<br />
4 14,061 8,024 1,867 2,871 1,299<br />
5 15,247 8,531 1,889 3,106 1,720<br />
6 15,810 10,005 1,333 3,026 1,445<br />
7 11,710 6,535 1,057 2,859 1,259<br />
8 8,716 4,967 765 2,029 955<br />
9 6,466 3,766 837 1,255 609<br />
10 10,582 5,511 1,326 2,948 796<br />
11 12,564 5,818 1,592 4,292 862<br />
12 9,261 5,690 1,091 1,862 618<br />
Total 141,865 82,170 16,223 31,367 12,105<br />
Table 13. Percentage of red snapper (commercial) landed by month in FL, GA, SC, and<br />
NC during 2001-2006 (lbs gutted weight) by state and month.<br />
Month Total FL GA SC NC<br />
1 8.48% 8.88% 7.73% 8.38% 6.99%<br />
2 8.64% 9.11% 12.20% 6.76% 5.49%<br />
3 9.29% 10.40% 7.61% 7.56% 8.50%<br />
4 9.91% 9.76% 11.51% 9.15% 10.73%<br />
5 10.75% 10.38% 11.65% 9.90% 14.21%<br />
6 11.14% 12.18% 8.22% 9.65% 11.94%<br />
7 8.25% 7.95% 6.52% 9.12% 10.40%<br />
8 6.14% 6.04% 4.72% 6.47% 7.89%<br />
9 4.56% 4.58% 5.16% 4.00% 5.03%<br />
10 7.46% 6.71% 8.17% 9.40% 6.58%<br />
11 8.86% 7.08% 9.81% 13.68% 7.12%<br />
12 6.53% 6.92% 6.72% 5.94% 5.11%<br />
10
1.6.2 Commercial – By Year<br />
Table 14. Average red snapper commercial landings 2001-2006 (lbs gutted weight) by state and month. Includes Monroe County.<br />
2001 2002 2003<br />
Month FL GA SC NC FL GA SC NC FL GA SC NC<br />
1 10,537 1,283 1,219 574 8,143 1,861 2,407 2,136 4,415 740 649 750<br />
2 13,341 3,081 2,914 679 5,434 2,641 2,168 1,168 5,783 3,549 1,157 802<br />
3 8,094 1,059 2,227 1,002 8,845 934 3,175 1,751 7,111 2,073 1,971 1,058<br />
4 10,553 2,858 2,846 1,942 7,555 3,131 3,243 2,511 4,776 2,800 3,216 1,289<br />
5 10,023 4,111 2,859 2,723 5,840 1,951 4,143 2,332 7,223 2,171 3,606 1,682<br />
6 6,922 1,826 2,344 2,157 12,865 2,351 5,032 2,660 21,871 1,413 4,373 1,478<br />
7 5,694 1,351 2,053 1,614 5,541 2,138 3,937 2,257 9,579 558 1,802 968<br />
8 7,143 1,063 1,459 1,924 5,438 1,055 3,287 1,415 3,130 698 1,410 732<br />
9 5,759 2,098 1,237 1,177 3,406 996 2,016 1,188 6,668 1,209 1,530 335<br />
10 6,534 2,549 3,217 1,275 10,092 1,235 3,166 1,051 5,443 1,387 3,277 980<br />
11 9,516 2,157 4,811 1,285 6,771 2,845 7,418 1,550 5,702 1,396 3,306 1,019<br />
12 11,849 1,150 2,932 1,560 5,949 1,636 1,988 1,032 5,494 1,547 1,943 512<br />
105,963 24,586 30,119 17,911 85,879 22,776 41,981 21,050 87,194 19,541 28,240 11,605<br />
59.34% 13.77% 16.87% 10.03% 50.02% 13.27% 24.45% 12.26% 59.49% 13.33% 19.27% 7.92%<br />
2004 2005 2006<br />
Month FL GA SC NC FL GA SC NC FL GA SC NC<br />
1 8,884 1,781 6,240 661 4,753 781 1,422 131 43,774 7,523 15,763 5,079<br />
2 5,738 866 2,605 857 8,371 470 768 129 44,912 11,872 12,727 3,990<br />
3 14,189 989 3,343 1,732 6,552 342 1,014 380 51,250 7,407 14,220 6,175<br />
4 11,411 1,545 3,991 1,047 8,510 124 1,169 560 48,142 11,201 17,225 7,795<br />
5 12,341 1,498 3,229 1,673 6,830 491 1,855 866 51,188 11,336 18,636 10,322<br />
6 7,548 1,288 2,241 687 3,346 441 1,444 897 60,032 7,997 18,158 8,672<br />
7 7,471 1,037 3,584 1,206 3,871 391 2,661 640 39,210 6,342 17,155 7,551<br />
8 7,536 582 2,263 705 1,287 307 1,056 543 29,803 4,591 12,171 5,730<br />
11
2004 2005 2006<br />
Month FL GA SC NC FL GA SC NC FL GA SC NC<br />
9 929 158 822 205 2,210 203 743 278 22,595 5,020 7,529 3,654<br />
10 4,604 1,816 3,712 497 2,497 327 1,367 695 33,068 7,956 17,690 4,777<br />
11 6,347 1,759 5,157 442 2,259 326 1,117 232 34,908 9,551 25,753 5,172<br />
12 3,122 1,874 1,921 286 4,646 329 1,186 178 34,141 6,543 11,173 3,711<br />
90,119 15,194 39,107 9,999 55,133 4,533 15,803 5,531 493,022 97,340 188,200 72,627<br />
58.36% 9.84% 25.33% 6.48% 68.07% 5.60% 19.51% 6.83% 57.92% 11.44% 22.11% 8.53%<br />
12
1.6.3 Headboat 2001-2006<br />
Table 14. Average red snapper headboat landings 2001-2006 (lbs gutted weight) by state<br />
and month.<br />
Month Total South FL GA - NFL SC NC<br />
1 1,555 72 1,402 46 36<br />
2 2,634 654 1,873 38 70<br />
3 4,185 480 3,046 519 140<br />
4 5,691 29 3,965 1,411 285<br />
5 7,857 89 4,719 2,577 472<br />
6 5,775 33 3,475 1,712 554<br />
7 5,578 50 3,501 1,553 474<br />
8 5,623 41 2,390 2,020 1,173<br />
9 2,927 16 1,491 576 844<br />
10 5,110 63 3,493 772 783<br />
11 4,316 155 2,690 1,275 196<br />
12 2,953 91 1,515 177 1,170<br />
54,204 1,773 33,560 12,675 6,197<br />
Table 15. Average gag headboat landings 2001-2006 (percentage) by state and month.<br />
Month Total South FL GA - NFL SC NC<br />
1 2.87% 4.04% 4.18% 0.36% 0.58%<br />
2 4.86% 36.88% 5.58% 0.30% 1.12%<br />
3 7.72% 27.07% 9.08% 4.09% 2.26%<br />
4 10.50% 1.66% 11.81% 11.13% 4.60%<br />
5 14.50% 5.04% 14.06% 20.33% 7.62%<br />
6 10.65% 1.86% 10.36% 13.51% 8.95%<br />
7 10.29% 2.82% 10.43% 12.25% 7.65%<br />
8 10.37% 2.29% 7.12% 15.94% 18.93%<br />
9 5.40% 0.90% 4.44% 4.54% 13.62%<br />
10 9.43% 3.57% 10.41% 6.09% 12.63%<br />
11 7.96% 8.75% 8.02% 10.06% 3.17%<br />
12 5.45% 5.13% 4.51% 1.40% 18.88%<br />
13
1.6.4 Headboat – By Year<br />
Table 16. Average red snapper headboat landings 2001-2006 (lbs gutted weight) by state and month.<br />
2001 2002 2003<br />
Month South FL GA - NFL SC NC South FL GA - NFL SC NC South FL GA - NFL SC NC<br />
1 8 222 3 4 14 143 43 3 2 80 0 3<br />
2 22 392 38 41 5 146 0 21 13 139 0 7<br />
3 13 515 100 30 81 433 123 61 5 333 0 26<br />
4 0 715 341 101 0 579 190 116 0 449 291 41<br />
5 56 703 559 81 0 881 480 278 0 579 841 34<br />
6 15 537 229 131 1 819 639 301 8 433 238 34<br />
7 3 606 371 94 3 733 411 286 9 215 177 38<br />
8 5 491 764 361 4 306 212 757 5 139 112 40<br />
9 0 306 149 402 0 244 155 225 3 200 93 186<br />
10 0 160 161 95 14 404 258 54 0 466 64 95<br />
11 148 458 235 96 3 295 736 30 1 312 8 49<br />
12 10 360 131 6 8 121 16 0 0 446 0 0<br />
Total 280 5,466 3,080 1,442 133 5,104 3,262 2,131 45 3,790 1,822 552<br />
Percent 2.73% 53.23% 30.00% 14.04% 1.25% 48.02% 30.69% 20.05% 0.72% 61.04% 29.34% 8.90%<br />
2004 2005 2006<br />
Month South FL GA - NFL SC NC South FL GA - NFL SC NC South FL GA - NFL SC NC<br />
1 1 241 0 17 42 322 0 7 4 395 0 2<br />
2 0 211 0 0 550 540 0 0 64 446 0 0<br />
3 12 384 266 15 334 754 21 5 35 627 9 3<br />
4 4 807 424 21 14 792 111 0 12 624 54 7<br />
5 0 705 488 29 11 1,116 130 33 22 735 79 17<br />
6 4 775 374 18 0 465 147 64 5 446 86 7<br />
7 0 1,112 334 15 7 511 116 39 28 324 144 4<br />
8 0 943 80 15 7 340 789 0 20 171 63 0<br />
9 4 44 43 13 2 319 95 5 7 378 42 13<br />
14
10 34 1,494 189 524 0 405 79 10 15 564 21 6<br />
11 1 777 192 16 0 333 73 5 2 515 32 0<br />
12 70 177 28 1,165 0 221 0 0 3 189 2 0<br />
Total 129 7,670 2,418 1,846 967 6,117 1,561 167 219 5,413 532 58<br />
Percent 1.07% 63.58% 20.04% 15.31% 10.97% 69.41% 17.72% 1.90% 3.52% 87.01% 8.54% 0.93%<br />
15
1.6.5 MRFSS 2001-2006<br />
Table 17. Average red snapper MRFSS landings 2001-2006 (lbs gutted weight) by state<br />
and month.<br />
Wave Total FL GA SC NC<br />
1 40,764 40,764 0 0 0<br />
2 54,953 50,729 1,212 2,421 591<br />
3 56,191 43,387 6,013 2,694 4,097<br />
4 32,870 28,210 1,309 1,980 1,371<br />
5 34,424 25,023 4,877 934 3,591<br />
6 51,104 46,602 1,528 2,431 543<br />
270,307 234,715 14,939 10,460 10,192<br />
Table 18. Average red snapper MRFSS landings 2001-2006 (percent lbs gutted weight)<br />
by state and month.<br />
Wave Total FL GA SC NC<br />
1 15.08% 17.37% 0.00% 0.00% 0.00%<br />
2 20.33% 21.61% 8.11% 23.15% 5.80%<br />
3 20.79% 18.49% 40.25% 25.76% 40.19%<br />
4 12.16% 12.02% 8.76% 18.92% 13.45%<br />
5 12.74% 10.66% 32.65% 8.93% 35.23%<br />
6 18.91% 19.85% 10.23% 23.24% 5.33%<br />
Table 19. Average red snapper MRFSS landings 2001-2006 (A+B1 Number) by state and<br />
month.<br />
Wave Total FL GA SC NC<br />
1 6,585 6,585 0 0 0<br />
2 7,732 7,096 101 472 64<br />
3 8,143 6,182 740 351 870<br />
4 4,612 3,900 142 240 330<br />
5 5,116 3,477 573 186 880<br />
6 7,807 7,176 208 339 84<br />
39,995 34,415 1,765 1,588 2,227<br />
Table 20. Average red snapper MRFSS landings 2001-2006 (A+B1 Number, percent) by<br />
state and month.<br />
Wave Total FL GA SC NC<br />
1 16.47% 19.13% 0.00% 0.00% 0.00%<br />
2 19.33% 20.62% 5.73% 29.70% 2.85%<br />
3 20.36% 17.96% 41.95% 22.12% 39.07%<br />
4 11.53% 11.33% 8.05% 15.13% 14.81%<br />
5 12.79% 10.10% 32.47% 11.73% 39.50%<br />
6 19.52% 20.85% 11.80% 21.32% 3.77%<br />
Table 21. Average red snapper MRFSS landings 2001-2006 (B2 Number) by state and<br />
month.<br />
Wave Total FL GA SC NC<br />
1 35,161 35,161 0 0 0<br />
2 29,400 28,612 490 297 0<br />
16
3 17,683 16,076 745 852 11<br />
4 17,590 15,676 1,429 456 29<br />
5 15,557 14,374 857 216 110<br />
6 45,617 44,987 465 165 0<br />
161,008 154,886 3,986 1,986 149<br />
Table 22. Average red snapper MRFSS landings 2001-2006 (B2 Number, percent) by<br />
state and month.<br />
Wave Total FL GA SC NC<br />
1 21.84% 22.70% 0.00% 0.00% 0.00%<br />
2 18.26% 18.47% 12.30% 14.96% 0.00%<br />
3 10.98% 10.38% 18.69% 42.87% 7.04%<br />
4 10.92% 10.12% 35.84% 22.96% 19.55%<br />
5 9.66% 9.28% 21.50% 10.89% 73.41%<br />
6 28.33% 29.04% 11.67% 8.32% 0.00%<br />
17
1.6.6 MRFSS – By Year<br />
Table 23. Average red snapper MRFSS landings 2001-2006 (lbs gutted weight) by state and month.<br />
2001 2002 2003<br />
Wave FL GA SC NC FL GA SC NC FL GA SC NC<br />
1 62,677 0 0 0 90,770 0 0 0 13,095 0 0 0<br />
2 30,992 377 0 0 78,840 0 0 0 61,961 656 10,580 0<br />
3 67,061 935 0 8,541 65,389 638 0 4,908 37,164 163 14,150 1,293<br />
4 18,669 0 0 1,901 54,684 0 0 2,940 22,806 1,479 6,493 2,206<br />
5 5,484 107 0 133 26,606 1,192 3,942 12,876 20,846 600 371 6,048<br />
6 113,362 0 12,020 0 9,019 295 71 0 34,847 1,357 0 0<br />
Total 298,245 1,420 12,020 10,575 325,308 2,125 4,014 20,723 190,719 4,255 31,594 9,547<br />
Percent 92.55% 0.44% 3.73% 3.28% 92.37% 0.60% 1.14% 5.88% 80.77% 1.80% 13.38% 4.04%<br />
2004 2005 2006<br />
Wave FL GA SC NC FL GA SC NC FL GA SC NC<br />
1 10,087 0 0 0 19,248 0 0 0 48,708 0 0 0<br />
2 32,334 1,309 1,347 0 53,950 4,930 1,042 3,545 46,298 0 1,559 0<br />
3 44,104 7,877 467 514 38,013 3,317 1,019 4,467 8,594 23,149 531 4,858<br />
4 35,452 1,297 570 0 24,753 5,078 4,814 1,177 12,895 0 0 0<br />
5 28,171 11,414 1,291 0 22,070 15,949 0 0 46,958 0 0 2,488<br />
6 77,050 7,514 1,649 3,259 30,984 0 648 0 20,155 0 198 0<br />
Total 227,198 29,411 5,323 3,774 189,017 29,274 7,523 9,189 183,608 23,149 2,288 7,346<br />
Percent 85.51% 11.07% 2.00% 1.42% 80.43% 12.46% 3.20% 3.91% 84.85% 10.70% 1.06% 3.39%<br />
Table 24. Average red snapper MRFSS landings 2001-2006 (A+B1 Number) by state and month.<br />
2001 2002 2003<br />
Wave FL GA SC NC FL GA SC NC FL GA SC NC<br />
1 11,501 0 0 0 12,916 0 0 0 2,811 0 0 0<br />
2 5,348 66 0 0 11,804 0 0 0 7,039 96 1,426 0<br />
3 9,248 123 0 2,098 11,872 86 0 795 4,007 21 1,867 256<br />
4 5,584 0 0 379 6,562 0 0 429 2,767 90 892 862<br />
18
2001 2002 2003<br />
Wave FL GA SC NC FL GA SC NC FL GA SC NC<br />
5 1,109 17 0 21 3,795 190 923 2,054 2,647 91 0 2,971<br />
6 14,978 0 1,608 0 1,759 72 31 0 5,102 162 0 0<br />
Total 47,768 206 1,608 2,498 48,708 348 954 3,278 24,373 460 4,185 4,089<br />
Percent 91.72% 0.40% 3.09% 4.80% 91.41% 0.65% 1.79% 6.15% 73.62% 1.39% 12.64% 12.35%<br />
2004 2005 2006<br />
Wave FL GA SC NC FL GA SC NC FL GA SC NC<br />
1 1,827 0 0 0 4,368 0 0 0 6,088 0 0 0<br />
2 5,994 110 179 0 6,890 335 103 381 5,501 0 1,121 0<br />
3 5,672 1,037 64 71 5,413 408 88 468 878 2,767 88 1,533<br />
4 4,102 262 75 0 3,308 500 474 309 1,074 0 0 0<br />
5 4,531 1,064 47 0 5,488 1,815 147 0 3,289 262 0 233<br />
6 12,668 1,016 255 504 5,332 0 113 0 3,218 0 24 0<br />
Total 34,794 3,489 620 575 30,799 3,058 925 1,158 20,048 3,029 1,233 1,766<br />
Percent 88.14% 8.84% 1.57% 1.46% 85.70% 8.51% 2.57% 3.22% 76.88% 11.62% 4.73% 6.77%<br />
Table 25. Average red snapper MRFSS landings 2001-2006 (B2 Number) by state and month.<br />
2001 2002 2003<br />
Wave FL GA SC NC FL GA SC NC FL GA SC NC<br />
1 79,799 0 0 0 54,344 0 0 0 34,643 0 0 0<br />
2 18,502 242 0 0 14,662 0 0 0 26,882 0 1,783 0<br />
3 18,549 0 0 0 8,366 0 0 63 26,022 192 3,361 0<br />
4 17,086 0 0 175 21,123 0 158 0 16,746 365 0 0<br />
5 10,020 356 969 138 15,949 152 0 0 7,050 31 0 0<br />
6 63,932 621 402 0 16,398 76 31 0 42,593 560 85 0<br />
Total 207,888 1,219 1,371 313 130,842 228 189 63 153,936 1,148 5,229 0<br />
Percent 98.62% 0.58% 0.65% 0.15% 99.63% 0.17% 0.14% 0.05% 96.02% 0.72% 3.26% 0.00%<br />
19
2004 2005 2006<br />
Wave FL GA SC NC FL GA SC NC FL GA SC NC<br />
1 18,967 0 0 0 9,958 0 0 0 13,255 0 0 0<br />
2 39,647 290 0 0 42,839 206 0 0 29,140 2,204 0 0<br />
3 22,070 1,367 0 0 10,921 2,911 1,660 0 10,528 0 88 0<br />
4 21,475 1,563 0 0 4,953 102 2,333 0 12,673 6,543 245 0<br />
5 26,063 2,229 0 0 18,668 616 329 0 8,496 1,758 0 519<br />
6 68,193 1,323 474 0 29,719 50 0 0 49,084 161 0 0<br />
Total 196,415 6,772 474 0 117,058 3,885 4,322 0 123,176 10,666 333 519<br />
Percent 96.44% 3.33% 0.23% 0.00% 93.45% 3.10% 3.45% 0.00% 91.45% 7.92% 0.25% 0.39%<br />
20
1.7 <strong>Red</strong> <strong>Snapper</strong> Commercial Percentage<br />
Table 26. <strong>Red</strong> <strong>Snapper</strong> % Commercial. Source ALS.<br />
1986 1987 1988 1989 1990 1991 1992 1993 1994 1995 1996 1997 1998 1999 2000 2001 2002 2003 2004 2005 2006<br />
1986 57.2% 52.3% 44.7% 44.6% 46.4% 45.8% 38.8% 40.6% 41.1% 42.3% 42.7% 42.8% 42.6% 42.0% 39.3% 38.7% 37.9% 37.7% 37.3% 36.9% 36.4%<br />
1987 47.7% 39.5% 41.3% 44.2% 43.9% 36.5% 38.7% 39.4% 40.9% 41.4% 41.6% 41.5% 40.9% 38.2% 37.6% 36.8% 36.7% 36.4% 36.0% 35.5%<br />
1988 33.3% 39.1% 43.3% 43.0% 34.7% 37.5% 38.5% 40.2% 40.8% 41.0% 40.9% 40.3% 37.5% 36.9% 36.2% 36.1% 35.8% 35.4% 34.9%<br />
1989 44.1% 48.5% 46.9% 35.1% 38.4% 39.4% 41.3% 41.9% 42.1% 41.9% 41.2% 37.9% 37.2% 36.4% 36.3% 36.0% 35.6% 35.0%<br />
1990 55.2% 49.1% 31.4% 36.5% 38.2% 40.7% 41.5% 41.7% 41.5% 40.7% 37.0% 36.4% 35.6% 35.5% 35.2% 34.8% 34.3%<br />
1991 42.0% 22.7% 31.5% 34.7% 38.1% 39.3% 39.8% 39.7% 38.9% 35.2% 34.8% 34.1% 34.2% 33.9% 33.6% 33.1%<br />
1992 13.6% 28.4% 33.1% 37.4% 38.9% 39.5% 39.4% 38.6% 34.6% 34.2% 33.5% 33.7% 33.5% 33.1% 32.7%<br />
1993 55.2% 50.1% 52.7% 51.8% 50.8% 49.4% 46.8% 39.9% 38.5% 37.1% 36.9% 36.3% 35.7% 35.0%<br />
1994 45.3% 51.3% 50.5% 49.4% 47.8% 45.0% 37.4% 36.3% 35.1% 35.1% 34.7% 34.2% 33.5%<br />
1995 59.9% 54.4% 51.5% 48.8% 44.9% 35.7% 34.8% 33.7% 33.9% 33.6% 33.2% 32.5%<br />
1996 48.6% 46.8% 44.5% 40.6% 31.4% 31.6% 31.1% 31.6% 31.6% 31.3% 30.8%<br />
1997 44.7% 42.0% 37.7% 27.9% 29.1% 29.2% 30.0% 30.2% 30.1% 29.6%<br />
1998 38.9% 34.4% 24.4% 27.0% 27.6% 28.8% 29.2% 29.2% 28.7%<br />
1999 30.9% 20.9% 25.2% 26.4% 27.9% 28.5% 28.6% 28.2%<br />
2000 16.1% 23.8% 25.7% 27.5% 28.2% 28.3% 27.9%<br />
2001 32.0% 30.6% 31.8% 31.7% 31.3% 30.4%<br />
2002 29.2% 31.7% 31.6% 31.1% 30.0%<br />
2003 35.1% 33.1% 31.9% 30.3%<br />
2004 31.4% 30.4% 28.7%<br />
2005 29.1% 26.9%<br />
2006 24.2%<br />
21
1.8 <strong>Red</strong> <strong>Snapper</strong> Recreational Percentage<br />
Table 27. <strong>Red</strong> <strong>Snapper</strong> % Recreational. Source MRFSS Web site, NMFS Headboat survey.<br />
1986 1987 1988 1989 1990 1991 1992 1993 1994 1995 1996 1997 1998 1999 2000 2001 2002 2003 2004 2005 2006<br />
1986 42.8% 47.7% 55.3% 55.4% 53.6% 54.2% 61.2% 59.4% 58.9% 57.7% 57.3% 57.2% 57.4% 58.0% 60.7% 61.3% 62.1% 62.3% 62.7% 63.1% 63.6%<br />
1987 52.3% 60.5% 58.7% 55.8% 56.1% 63.5% 61.3% 60.6% 59.1% 58.6% 58.4% 58.5% 59.1% 61.8% 62.4% 63.2% 63.3% 63.6% 64.0% 64.5%<br />
1988 66.7% 60.9% 56.7% 57.0% 65.3% 62.5% 61.5% 59.8% 59.2% 59.0% 59.1% 59.7% 62.5% 63.1% 63.8% 63.9% 64.2% 64.6% 65.1%<br />
1989 55.9% 51.5% 53.1% 64.9% 61.6% 60.6% 58.7% 58.1% 57.9% 58.1% 58.8% 62.1% 62.8% 63.6% 63.7% 64.0% 64.4% 65.0%<br />
1990 44.8% 50.9% 68.6% 63.5% 61.8% 59.3% 58.5% 58.3% 58.5% 59.3% 63.0% 63.6% 64.4% 64.5% 64.8% 65.2% 65.7%<br />
1991 58.0% 77.3% 68.5% 65.3% 61.9% 60.7% 60.2% 60.3% 61.1% 64.8% 65.2% 65.9% 65.8% 66.1% 66.4% 66.9%<br />
1992 86.4% 71.6% 66.9% 62.6% 61.1% 60.5% 60.6% 61.4% 65.4% 65.8% 66.5% 66.3% 66.5% 66.9% 67.3%<br />
1993 44.8% 49.9% 47.3% 48.2% 49.2% 50.6% 53.2% 60.1% 61.5% 62.9% 63.1% 63.7% 64.3% 65.0%<br />
1994 54.7% 48.7% 49.5% 50.6% 52.2% 55.0% 62.6% 63.7% 64.9% 64.9% 65.3% 65.8% 66.5%<br />
1995 40.1% 45.6% 48.5% 51.2% 55.1% 64.3% 65.2% 66.3% 66.1% 66.4% 66.8% 67.5%<br />
1996 51.4% 53.2% 55.5% 59.4% 68.6% 68.4% 68.9% 68.4% 68.4% 68.7% 69.2%<br />
1997 55.3% 58.0% 62.3% 72.1% 70.9% 70.8% 70.0% 69.8% 69.9% 70.4%<br />
1998 61.1% 65.6% 75.6% 73.0% 72.4% 71.2% 70.8% 70.8% 71.3%<br />
1999 69.1% 79.1% 74.8% 73.6% 72.1% 71.5% 71.4% 71.8%<br />
2000 83.9% 76.2% 74.3% 72.5% 71.8% 71.7% 72.1%<br />
2001 68.0% 69.4% 68.2% 68.3% 68.7% 69.6%<br />
2002 70.8% 68.3% 68.4% 68.9% 70.0%<br />
2003 64.9% 66.9% 68.1% 69.7%<br />
2004 68.6% 69.6% 71.3%<br />
2005 70.9% 73.1%<br />
2006 75.8%<br />
22
2 Monthly catch and reduction provided by seasonal closure<br />
2.1 Commercial<br />
Table 28. Monthly catch (pounds gutted weight) of red snapper 2001-2006 (average).<br />
Data are from ALS.<br />
Month Total<br />
1 12,023<br />
2 12,250<br />
3 13,175<br />
4 14,061<br />
5 15,247<br />
6 15,810<br />
7 11,710<br />
8 8,716<br />
9 6,466<br />
10 10,582<br />
11 12,564<br />
12 9,261<br />
Total 141,865<br />
23
2.1.1 Effectiveness of Commercial Closure<br />
Five steps were taken to determine the effectiveness of a commercial closure. Logbook<br />
data from 2001-2006 were examined to identify species most commonly caught on trips<br />
with red snapper by restricting trips to those that caught at least 1 lb of red snapper.<br />
Incidental catch during a seasonal closure was determined by identifying trips that<br />
targeted (caught at least 100 lbs) of co-occurring species; and calculating the catch of red<br />
snapper on those trips. Trips targeting red snapper were removed from analyses<br />
assuming that targeting would not occur in the future. A trip would be considered to be<br />
targeting red snapper if greater than 300 lb whole weight of the landings on a trip<br />
included the species. In addition, trips that employed diving gear, were not considered in<br />
analyses since fishermen can recognize a species before it is captured.<br />
There is a possibility some trips would not be taken during a seasonal closure for species<br />
such as gag or vermilion snapper. However, it was assumed that there would not be any<br />
reduction in trips made if red snapper was closed. The ability to avoid red snapper was<br />
considered by adjusting values by 0 to 60% to account for fishermen’s ability to avoid<br />
red snapper by changing hook size, location, and fishing methods. Dead discards were<br />
determined by applying a 90% release mortality rate for red snapper (SEDAR 15 2008).<br />
Effectiveness of closure was determined by comparing the magnitude of dead discards to<br />
actual landings. Effectiveness of a seasonal closure for red snapper could be increased<br />
through seasonal closures of co-occurring species.<br />
STEP 1 - Determine landings of red snapper during 2001-2006<br />
Table 29. Landings of red snapper during 2001-2006 from logbook.<br />
Month Tot WW Tot GW Avg GW<br />
1 77,834 70,120 11,687<br />
2 80,182 72,236 12,039<br />
3 75,730 68,226 11,371<br />
4 84,599 76,215 12,703<br />
5 107,954 97,256 16,209<br />
6 82,833 74,625 12,437<br />
7 68,230 61,468 10,245<br />
8 60,277 54,303 9,051<br />
9 41,581 37,460 6,243<br />
10 70,417 63,439 10,573<br />
11 81,736 73,636 12,273<br />
12 60,763 54,741 9,124<br />
sum 133,954<br />
STEP 2 - Identify most common species taken with red snapper<br />
Table 30. Species most commonly taken on trips where at least 1 lb of red snapper was<br />
caught.<br />
Species sum percent cum %<br />
SNAPPER,VERMILION 1,196,673 29.48% 29.48%<br />
GROUPER,GAG 536,337 13.21% 42.69%<br />
SCAMP 350,126 8.62% 51.31%<br />
AMBERJACK,GREATER 266,201 6.56% 57.87%<br />
TRIGGERFISH,GRAY 235,453 5.80% 63.67%<br />
24
Species sum percent cum %<br />
SNAPPER,RED 206,503 5.09% 68.75%<br />
GROUPER,RED 197,286 4.86% 73.61%<br />
JACK,ALMACO 138,184 3.40% 77.02%<br />
GROUPER,BLACK 102,904 2.53% 79.55%<br />
GROUPER,SNOWY 68,959 1.70% 81.25%<br />
KING MACKEREL 61,016 1.50% 82.75%<br />
SEA<br />
BASSE,ATLANTIC,BLACK,UNC 60,606 1.49% 84.24%<br />
DOLPHINFISH 50,162 1.24% 85.48%<br />
PORGY,RED,UNC 47,059 1.16% 86.64%<br />
SNAPPER,MUTTON 45,057 1.11% 87.75%<br />
SHARK,SANDBAR 44,004 1.08% 88.83%<br />
GRUNTS 36,828 0.91% 89.74%<br />
PORGY,JOLTHEAD 29,657 0.73% 90.47%<br />
GRUNT,WHITE 27,815 0.69% 91.16%<br />
STEP 3 – Identify trips that target co-occurring species.<br />
Identify trips that caught at least 100 lbs (directed catch) of co-occurring species during a<br />
seasonal closure.<br />
STEP 4 - Determine incidental catch.<br />
This step determines the incidental catch red snapper during a seasonal closure. Trips that use<br />
diving gear or target red snapper (where > 300 lbs ww are caught) are dropped. This step does<br />
not take into consideration trips that will not be taken during a closure or ability of fishermen to<br />
avoid red snapper.<br />
Table 31. Incidental catch of red snapper during a seasonal closure. Dead discards<br />
determined by applying 40% release mortality rate. Not adjusted for behavior.<br />
Dead<br />
Month Tot WW Tot GW Avg GW discards<br />
1 43,001 38,740 6,457 5,811<br />
2 41,160 37,081 6,180 5,562<br />
3 39,223 35,336 5,889 5,300<br />
4 48,137 43,366 7,228 6,505<br />
5 60,886 54,852 9,142 8,228<br />
6 53,904 48,562 8,094 7,284<br />
7 41,600 37,477 6,246 5,622<br />
8 34,415 31,004 5,167 4,651<br />
9 24,182 21,785 3,631 3,268<br />
10 40,176 36,194 6,032 5,429<br />
11 46,262 41,677 6,946 6,252<br />
12 30,651 27,614 4,602 4,142<br />
sum 75,615 68,053<br />
STEP 5 – Determine incidental catch for reduced trips after quota.<br />
Assumption is that no trips would be reduced because of complete closure for red snapper since it<br />
is not likely that this is the primary species taken on trips.<br />
25
Table 32. Dead discards (lbs gutted weight) of red snapper during a seasonal closure (Average<br />
2001-2006). Dead discards determined by applying 90% release mortality rate. Assumes<br />
fishermen can avoid 0-60% of red snapper by fishing differently.<br />
<strong>Red</strong>uction<br />
Month 0% 20% 40% 60%<br />
1 5,811 4,649 3,487 2,324<br />
2 5,562 4,450 3,337 2,225<br />
3 5,300 4,240 3,180 2,120<br />
4 6,505 5,204 3,903 2,602<br />
5 8,228 6,582 4,937 3,291<br />
6 7,284 5,827 4,371 2,914<br />
7 5,622 4,497 3,373 2,249<br />
8 4,651 3,721 2,790 1,860<br />
9 3,268 2,614 1,961 1,307<br />
10 5,429 4,343 3,257 2,172<br />
11 6,252 5,001 3,751 2,501<br />
12 4,142 3,314 2,485 1,657<br />
Total<br />
removals 68,053 54,443 40,832 27,221<br />
<strong>Red</strong>uction in<br />
total removals<br />
(Effectiveness<br />
of closure) 49.2% 59.4% 69.5% 79.7%<br />
2.1.2 Monthly reduction in total removals from commercial seasonal closure<br />
Table 33. Monthly reduction in take based on 2001-2006 data if a seasonal closure is<br />
100% effective.<br />
Month 1 2 3 4 5 6 7 8 9 10 11 12<br />
1 0.09 0.18 0.26 0.36 0.48 0.57 0.65 0.71 0.76 0.84 0.93 1.00<br />
2 0.09 0.17 0.27 0.39 0.48 0.56 0.63 0.67 0.75 0.84 0.91<br />
3 0.08 0.18 0.30 0.39 0.47 0.54 0.58 0.66 0.75 0.82<br />
4 0.09 0.22 0.31 0.39 0.45 0.50 0.58 0.67 0.74<br />
5 0.12 0.21 0.29 0.36 0.40 0.48 0.58 0.64<br />
6 0.09 0.17 0.24 0.28 0.36 0.45 0.52<br />
7 0.08 0.14 0.19 0.27 0.36 0.43<br />
8 0.07 0.11 0.19 0.28 0.35<br />
9 0.05 0.13 0.22 0.29<br />
10 0.08 0.17 0.24<br />
11 0.09 0.16<br />
12 0.07<br />
Table 34. Monthly reduction in take based on 2001-2006 data if a seasonal closure is<br />
59% effective.<br />
Month 1 2 3 4 5 6 7 8 9 10 11 12<br />
1 0.05 0.11 0.16 0.21 0.28 0.34 0.38 0.42 0.45 0.50 0.55 0.59<br />
2 0.05 0.10 0.16 0.23 0.29 0.33 0.37 0.40 0.45 0.50 0.54<br />
3 0.05 0.11 0.18 0.23 0.28 0.32 0.35 0.39 0.45 0.49<br />
4 0.06 0.13 0.18 0.23 0.27 0.30 0.34 0.40 0.44<br />
5 0.07 0.13 0.17 0.21 0.24 0.29 0.34 0.38<br />
26
Month 1 2 3 4 5 6 7 8 9 10 11 12<br />
6 0.06 0.10 0.14 0.17 0.22 0.27 0.31<br />
7 0.05 0.09 0.11 0.16 0.21 0.26<br />
8 0.04 0.07 0.11 0.17 0.21<br />
9 0.03 0.07 0.13 0.17<br />
10 0.05 0.10 0.14<br />
11 0.05 0.09<br />
12 0.04<br />
2.2 Recreational<br />
Table 35. Commercial, headboat, and MRFSS (A+B1) landings in pounds whole weight.<br />
Year ALS HB MRFSS<br />
1986 202,468 48,991 102,264<br />
1987 176,866 73,728 120,427<br />
1988 159,443 117,178 202,698<br />
1989 241,755 63,779 242,157<br />
1990 200,742 59,176 103,875<br />
1991 132,881 64,891 118,480<br />
1992 91,926 26,050 556,498<br />
1993 204,283 38,484 127,557<br />
1994 182,043 38,753 180,644<br />
1995 166,342 51,778 59,463<br />
1996 129,789 41,652 95,682<br />
1997 102,111 46,130 80,095<br />
1998 81,463 24,187 103,570<br />
1999 85,786 39,241 152,641<br />
2000 95,214 44,506 450,378<br />
2001 178,579 61,607 318,580<br />
2002 171,686 63,780 352,170<br />
2003 146,579 37,255 233,616<br />
2004 154,419 72,380 264,790<br />
2005 118,924 52,878 236,294<br />
2006 81,000 37,325 216,393<br />
2007 91,475 0 266,008<br />
2.2.1 Headboat<br />
Six steps were taken to determine the effectiveness of a closure for the headboat fishery.<br />
Headboat data from 2001-2006 were examined to identify species most commonly<br />
caught on trips with red snapper by restricting trips to those that caught at least 1 of red<br />
snapper. Incidental catch during a seasonal closure was determined by identifying trips<br />
that caught co-occurring species; and calculating the catch of red snapper on those trips.<br />
There is a possibility some trips would not be taken during a seasonal closure for species<br />
such as gag or vermilion snapper. However, it was assumed that there would not be any<br />
reduction in trips made if red snapper was closed. The ability to avoid red snapper was<br />
considered by adjusting values by 0 to 60% to account for fishermen’s ability to avoid<br />
red snapper by changing hook size, location, and fishing methods. Dead discards were<br />
27
determined by applying a 40% release mortality rate for red snapper (SEDAR 15 2008).<br />
Effectiveness of closure was determined by comparing the magnitude of dead discards to<br />
actual landings. Effectiveness of a closure for red snapper could be increased by closing<br />
co-occurring species.<br />
STEP 1 - Determine landings of red snapper during 2001-2006<br />
Table 36. Landings of red snapper during 2001-2006 from headboat.<br />
Month tot ww tot gw avg gw<br />
1 10,355 9,329 1,555<br />
2 17,546 15,807 2,634<br />
3 27,872 25,109 4,185<br />
4 37,900 34,144 5,691<br />
5 52,331 47,145 7,857<br />
6 38,459 34,648 5,775<br />
7 37,148 33,466 5,578<br />
8 37,448 33,737 5,623<br />
9 19,491 17,560 2,927<br />
10 34,035 30,662 5,110<br />
11 28,747 25,898 4,316<br />
12 19,669 17,719 2,953<br />
54,204<br />
STEP 2 - Identify most common species taken with red snapper<br />
Table 37. Species most commonly taken on trips where at least 1 red snapper was<br />
caught. Represents sample (catch in numbers) during 2001-2005 not total catch.<br />
Species sum Percent Cum %<br />
Vermilion <strong>Snapper</strong> 405,485 50.34% 50.34%<br />
Black Sea Bass 98,090 12.18% 62.52%<br />
Tomtate 48,416 6.01% 68.53%<br />
White Grunt 31,711 3.94% 72.46%<br />
Gray Triggerfish 27,885 3.46% 75.93%<br />
<strong>Red</strong> Porgy 25,053 3.11% 79.04%<br />
<strong>Red</strong> <strong>Snapper</strong> 20,870 2.59% 81.63%<br />
Spottail Pinfish 20,388 2.53% 84.16%<br />
Banded Rudderfish 11,744 1.46% 85.62%<br />
Scamp 11,643 1.45% 87.06%<br />
Mutton <strong>Snapper</strong> 10,955 1.36% 88.42%<br />
Sharpnose Shark 10,893 1.35% 89.77%<br />
Lane <strong>Snapper</strong> 8,367 1.04% 90.81%<br />
Knobbed Porgy 7,954 0.99% 91.80%<br />
STEP 3 – Identify trips that target co-occurring species.<br />
Identify trips that caught of co-occurring species during a seasonal closure.<br />
STEP 4 - Determine incidental catch.<br />
28
This step determines the incidental catch red snapper during a seasonal closure. This step does<br />
not take into consideration trips that will not be taken during a closure or ability of fishermen to<br />
avoid red snapper.<br />
Table 38. Incidental catch (numbers) of red snapper during a seasonal closure. Dead<br />
discards determined by applying 40% release mortality rate. Value represents sample,<br />
not total catch.<br />
Species sum dead discards<br />
<strong>Red</strong> <strong>Snapper</strong> 20,265 8,106<br />
STEP 5 – Determine effectiveness of closure.<br />
A comparison of the estimate of dead discards (8,106) in step 4 to sampled catch in step 2<br />
(20,870) indicates during a complete prohibition in catch of red snapper by headboat<br />
38.8% would be discarded and die due to incidental catch.<br />
STEP 6 – Determine dead discards for reduced trips and behavior after quota. This step<br />
assumes that fishermen could have the ability to avoid red snapper by fishing differently.<br />
Table 39. Dead discards (lbs gutted weight) of red snapper during a seasonal closure<br />
(Average 2001-2006). Dead discards determined by applying 40% release mortality rate.<br />
Assumes fishermen can avoid 0-60% of red snapper by fishing differently.<br />
<strong>Red</strong>uction<br />
Month 0% 20% 40% 60%<br />
1 604 483 362 242<br />
2 1,023 819 614 409<br />
3 1,625 1,300 975 650<br />
4 2,210 1,768 1,326 884<br />
5 3,052 2,442 1,831 1,221<br />
6 2,243 1,794 1,346 897<br />
7 2,166 1,733 1,300 867<br />
8 2,184 1,747 1,310 874<br />
9 1,137 909 682 455<br />
10 1,985 1,588 1,191 794<br />
11 1,677 1,341 1,006 671<br />
12 1,147 918 688 459<br />
Number that die 21,053 16,843 12,632 8,421<br />
Percent that live 61.2% 68.9% 76.7% 84.5%<br />
Percent that die 38.8% 31.1% 23.3% 15.5%<br />
2.2.2 Monthly reduction in total removals from headboat seasonal closure<br />
Table 40. Monthly reduction in take based on 2001-2006 data if a seasonal closure is<br />
100% effective.<br />
Month 1 2 3 4 5 6 7 8 9 10 11 12<br />
1 0.03 0.08 0.15 0.26 0.40 0.51 0.61 0.72 0.77 0.87 0.95 1.00<br />
2 0.05 0.13 0.23 0.38 0.48 0.59 0.69 0.74 0.84 0.92 0.97<br />
3 0.08 0.18 0.33 0.43 0.54 0.64 0.69 0.79 0.87 0.92<br />
4 0.10 0.25 0.36 0.46 0.56 0.62 0.71 0.79 0.85<br />
5 0.14 0.25 0.35 0.46 0.51 0.61 0.69 0.74<br />
29
Month 1 2 3 4 5 6 7 8 9 10 11 12<br />
6 0.11 0.21 0.31 0.37 0.46 0.54 0.60<br />
7 0.10 0.21 0.26 0.35 0.43 0.49<br />
8 0.10 0.16 0.25 0.33 0.39<br />
9 0.05 0.15 0.23 0.28<br />
10 0.09 0.17 0.23<br />
11 0.08 0.13<br />
12 0.05<br />
Table 41. Monthly reduction in take based on 2001-2006 data if a seasonal closure is<br />
69% effective.<br />
Month 1 2 3 4 5 6 7 8 9 10 11 12<br />
1 0.02 0.05 0.11 0.18 0.28 0.35 0.42 0.49 0.53 0.60 0.65 0.69<br />
2 0.03 0.09 0.16 0.26 0.33 0.40 0.47 0.51 0.58 0.63 0.67<br />
3 0.05 0.13 0.23 0.30 0.37 0.44 0.48 0.54 0.60 0.64<br />
4 0.07 0.17 0.25 0.32 0.39 0.43 0.49 0.55 0.58<br />
5 0.10 0.17 0.24 0.32 0.35 0.42 0.47 0.51<br />
6 0.07 0.14 0.22 0.25 0.32 0.37 0.41<br />
7 0.07 0.14 0.18 0.24 0.30 0.34<br />
8 0.07 0.11 0.17 0.23 0.27<br />
9 0.04 0.10 0.16 0.19<br />
10 0.06 0.12 0.16<br />
11 0.05 0.09<br />
30
2.2.3 MRFSS<br />
Six steps were taken to determine the effectiveness of a closure for the recreational<br />
(MRFSS) fishery. MRFSS data from 2001-2006 were examined to identify species most<br />
commonly caught on trips with red snapper by restricting trips to those that caught at<br />
least 1 red snapper. Incidental catch during a seasonal closure was determined by<br />
identifying trips that caught co-occurring species; and calculating the catch of red snapper<br />
on those trips.<br />
There is a possibility some trips would not be taken during a seasonal closure for species<br />
such as gag or vermilion snapper. However, it was assumed that there would not be any<br />
reduction in trips made if red snapper was closed. The ability to avoid red snapper was<br />
considered by adjusting values by 0 to 60% to account for fishermen’s ability to avoid<br />
red snapper by changing hook size, location, and fishing methods. Dead discards were<br />
determined by applying a 40% release mortality rate for red snapper (SEDAR 15 2008).<br />
Effectiveness of closure was determined by comparing the magnitude of dead discards to<br />
actual landings.<br />
STEP 1 - Determine landings of red snapper during 2001-2006<br />
Table 42. Landings of red snapper during 2001-2006 from MRFSS Web site.<br />
Month tot ww tot gw avg gw<br />
1 135,745 122,292 20,382<br />
2 135,745 122,292 20,382<br />
3 182,995 164,860 27,477<br />
4 182,995 164,860 27,477<br />
5 187,118 168,574 28,096<br />
6 187,118 168,574 28,096<br />
7 109,456 98,609 16,435<br />
8 109,456 98,609 16,435<br />
9 114,634 103,273 17,212<br />
10 114,634 103,273 17,212<br />
11 170,176 153,312 25,552<br />
12 170,176 153,312 25,552<br />
270,307<br />
STEP 2 - Identify most common species taken with red snapper<br />
Table 43. Species most commonly taken on trips where at least 1 red snapper was<br />
caught. Represents sample (A+B1 in numbers) during 2001-2005 not total catch.<br />
Species sum percent cum per<br />
vermilion snapper 4,278 26.91% 26.91%<br />
black sea bass 3,271 20.58% 47.49%<br />
red snapper 1,300 8.18% 55.66%<br />
white grunt 903 5.68% 61.34%<br />
gray triggerfish 804 5.06% 66.40%<br />
greater amberjack 386 2.43% 68.83%<br />
red porgy 351 2.21% 71.04%<br />
Gag 345 2.17% 73.21%<br />
Tomtate 341 2.15% 75.35%<br />
king mackerel 335 2.11% 77.46%<br />
31
Species sum percent cum per<br />
gray snapper 330 2.08% 79.54%<br />
atlantic sharpnose shark 308 1.94% 81.47%<br />
round scad 297 1.87% 83.34%<br />
Scamp 210 1.32% 84.66%<br />
lane snapper 209 1.31% 85.98%<br />
Dolphin 198 1.25% 87.22%<br />
spanish sardine 171 1.08% 88.30%<br />
spottail pinfish 142 0.89% 89.19%<br />
red grouper 126 0.79% 89.99%<br />
almaco jack 109 0.69% 90.67%<br />
STEP 3 – Identify trips that target co-occurring species.<br />
Identify trips that caught of co-occurring species during a seasonal closure.<br />
STEP 4 - Determine incidental catch.<br />
This step determines the incidental catch red snapper during a seasonal closure. This step does<br />
not take into consideration trips that will not be taken during a closure or ability of fishermen to<br />
avoid red snapper.<br />
Table 44. Incidental catch (numbers) of red snapper during a seasonal closure. Dead<br />
discards determined by applying 40% release mortality rate. Value represents sample,<br />
not total catch.<br />
Species sum dead discards<br />
<strong>Red</strong> <strong>Snapper</strong> 1,166 466.4<br />
STEP 5 – Determine effectiveness of closure.<br />
A comparison of the estimate of dead discards (466) in step 4 to sampled catch in step 2<br />
(1,300) indicates during a complete prohibition in catch of red snapper by recreational<br />
fishermen 35.9% could still die when due to incidental catch.<br />
STEP 6 – Determine dead discards for reduced trips and behavior after quota. This step<br />
assumes that fishermen could have the ability to avoid red snapper by fishing differently.<br />
Table 45. Dead discards (lbs gutted weight) of red snapper during a seasonal closure<br />
(Average 2001-2006). Dead discards determined by applying 40% release mortality rate.<br />
Assumes fishermen can avoid 0-60% of red snapper by fishing differently.<br />
<strong>Red</strong>uction<br />
Month 0% 20% 40% 60%<br />
1 7,312 5,850 4,387 2,925<br />
2 7,312 5,850 4,387 2,925<br />
3 9,858 7,886 5,915 3,943<br />
4 9,858 7,886 5,915 3,943<br />
5 10,080 8,064 6,048 4,032<br />
6 10,080 8,064 6,048 4,032<br />
7 5,896 4,717 3,538 2,359<br />
8 5,896 4,717 3,538 2,359<br />
9 6,175 4,940 3,705 2,470<br />
10 6,175 4,940 3,705 2,470<br />
32
11 9,167 7,334 5,500 3,667<br />
12 9,167 7,334 5,500 3,667<br />
Number that die 96,978 77,582 58,187 38,792<br />
Percent that live 64.1% 71.3% 78.5% 85.6%<br />
Percent that die 35.9% 28.7% 21.5% 14.4%<br />
2.2.4 Monthly reduction in total removals from MRFSS seasonal closure<br />
Table 46. Monthly reduction in take based on 2001-2006 data if a seasonal closure is<br />
100% effective.<br />
Month 1 2 3 4 5 6 7 8 9 10 11 12<br />
1 0.08 0.15 0.25 0.35 0.46 0.56 0.62 0.68 0.75 0.81 0.91 1.00<br />
2 0.08 0.18 0.28 0.38 0.49 0.55 0.61 0.67 0.74 0.83 0.92<br />
3 0.10 0.20 0.31 0.41 0.47 0.53 0.60 0.66 0.75 0.85<br />
4 0.10 0.21 0.31 0.37 0.43 0.49 0.56 0.65 0.75<br />
5 0.10 0.21 0.27 0.33 0.39 0.46 0.55 0.65<br />
6 0.10 0.16 0.23 0.29 0.35 0.45 0.54<br />
7 0.06 0.12 0.19 0.25 0.34 0.44<br />
8 0.06 0.12 0.19 0.28 0.38<br />
9 0.06 0.13 0.22 0.32<br />
10 0.06 0.16 0.25<br />
11 0.09 0.19<br />
12 0.09<br />
Table 47. Monthly reduction in take based on 2001-2006 data if a seasonal closure is<br />
71.3% effective.<br />
Month 1 2 3 4 5 6 7 8 9 10 11 12<br />
1 0.05 0.11 0.18 0.25 0.33 0.40 0.44 0.49 0.53 0.58 0.65 0.71<br />
2 0.05 0.13 0.20 0.27 0.35 0.39 0.43 0.48 0.52 0.59 0.66<br />
3 0.07 0.14 0.22 0.29 0.34 0.38 0.43 0.47 0.54 0.61<br />
4 0.07 0.15 0.22 0.26 0.31 0.35 0.40 0.47 0.53<br />
5 0.07 0.15 0.19 0.23 0.28 0.33 0.39 0.46<br />
6 0.07 0.12 0.16 0.21 0.25 0.32 0.39<br />
7 0.04 0.09 0.13 0.18 0.24 0.31<br />
8 0.04 0.09 0.13 0.20 0.27<br />
9 0.05 0.09 0.16 0.23<br />
10 0.05 0.11 0.18<br />
11 0.07 0.13<br />
12 0.07<br />
2.3 <strong>Red</strong>uction in total removals from prohibition in catch of red snapper<br />
Methodology is similar to determining effectiveness of seasonal closure with exception<br />
that reductions are applied to landings and discards in numbers for the sectors.<br />
STEP 1 - Determine landings in numbers for red snapper during 2001-2006 using<br />
information from SEDAR 15 (2008).<br />
STEP 2 – Determine average landings in lbs from logbook and average sampled landings<br />
from Headboat and MRFSS in numbers for 2001-2006.<br />
33
STEP 3 - Identify most common species taken with red snapper.<br />
• Logbook data from 2001-2006 were examined to identify species most commonly<br />
caught on trips with red snapper by restricting trips to those that caught at least 1<br />
lb of red snapper.<br />
• Headboat and MRFSS data from 2001-2006 were examined to identify species<br />
most commonly caught on trips with red snapper by restricting trips to those that<br />
caught at least 1 red snapper.<br />
STEP 4 – Identify trips that target co-occurring species.<br />
STEP 5 - Determine incidental catch.<br />
• For the commercial sector, incidental catch during a seasonal closure was<br />
determined by identifying trips that targeted (caught at least 100 lbs) of cooccurring<br />
species; and calculating the catch of red snapper on those trips. Trips<br />
targeting red snapper were removed from analyses assuming that targeting would<br />
not occur in the future. A trip would be considered to be targeting red snapper if<br />
greater than 300 lb whole weight of the landings on a trip included the species. In<br />
addition, trips that employed diving gear, were not considered in analyses since<br />
fishermen can recognize a species before it is captured.<br />
• For the recreational sector, incidental catch during a seasonal closure was<br />
determined by identifying trips that caught co-occurring species; and calculating<br />
the catch of red snapper on those trips.<br />
STEP 6 – Determine total removals for reduced trips and behavior after quota. This step<br />
assumes that fishermen could have the ability to avoid red snapper by fishing differently.<br />
STEP 7 – Compare estimate of total removals in step 6 to landings for database in step 2.<br />
STEP 8 – Apply reduction in total removals to landings and discards in step 1.<br />
Landings and discards in numbers is provided by the SEDAR 15 (2008) stock<br />
assessment. The stock assessment provides the number of dead discards that could be<br />
taken and allow the stock to rebuild if there was no allowable catch. This value is 37,000<br />
individuals (Table 48). A lower value would be needed if rebuilding at Foy or F40%.<br />
34
Table 48. Table 3.24 from red snapper SEDAR 15 (2008) stock assessment<br />
Table 49 indicates the average catch of red snapper during 2001-2006 was 65,115<br />
individuals and the total number of discards (live and dead) was 214,155. If all catch of<br />
red snapper was prohibited and there was no reduction in fishing effort the total<br />
removals, which would be dead discards, would be 129,016 individuals. Projections<br />
from SEDAR 15 (2008) indicate if all catch of red snapper was prohibited, the allowable<br />
number of dead discards would be 37,000 individuals. A lower number would be<br />
required to achieve the yield at Foy or F40%.<br />
Table 49. Number of red snapper landed and discarded by sector during 2001-2006 and<br />
number of dead discards that would occur if all catch of red snapper was prohibited.<br />
Item Comm MRFSS HB Total<br />
Current<br />
landings 15,825 39,897 9,393 65,115<br />
Current<br />
discards 18,792 158,288 37,075 214,155<br />
Current<br />
landings<br />
and all<br />
discards 34,617 198,185 46,468 279,270<br />
Dead<br />
discards 31,155 79,274 18,587 129,016<br />
35
Although a large number of red snapper are probably taken when targeting co-occurring<br />
species, there is probably some degree of targeting. If one assumes that during a closure<br />
red snapper are only taken when targeting major co-occurring species, some trips will not<br />
be taken during a seasonal closure for gag, and fishermen have some ability to avoid red<br />
snapper by avoiding locations and changing fishing gear, then the number of dead<br />
discards would be expected to be lower (Table 50).<br />
Table 50. Current total removals (landings and dead discards) of red snapper by sector in<br />
number during 2001-2006, total removals (number) assuming fishermen cannot avoid red<br />
snapper incidental catch, and reduction in total removals assuming fishermen can avoid<br />
20% of red snapper incidental catch.<br />
Item Comm MRFSS HB Total<br />
Current<br />
landings<br />
and dead<br />
discards 32,737 103,212 24,223 160,173<br />
Total<br />
removals<br />
assuming<br />
0%<br />
avoidance 18,480 37,029 9,408 64,917<br />
Total<br />
removals<br />
assuming<br />
20%<br />
avoidance 14,784 29,624 7,527 51,934<br />
Table 51. Current total removals (landings and dead discards) of red snapper by sector in<br />
number during 2001-2006, total removals (number) assuming fishermen cannot avoid red<br />
snapper incidental catch, and reduction in total removals assuming fishermen can avoid<br />
20% of red snapper incidental catch. This assumes there would be a January-April<br />
seasonal closure for gag and 20% of the trips would not be made during vermilion<br />
snapper and gag seasonal closures.<br />
Item Comm MRFSS HB Total<br />
Current<br />
landings<br />
and dead<br />
discards 32,737 103,212 24,223 160,173<br />
Dead<br />
discards<br />
assuming<br />
0%<br />
avoidance 13,358 33,419 9,408 56,186<br />
Dead<br />
discards<br />
assuming<br />
20%<br />
avoidance 10,686 26,736 7,527 44,948<br />
36
2.4 Locations where red snapper are caught<br />
2.4.1 Commercial<br />
Table 52. Commercial landings (pounds whole weight) of red snapper by statistical grid<br />
2001-2006. Shaded area represents locations where 53% of the red snapper were caught.<br />
Grid Average 2001-06 Percent Grid Average 2001-06 Percent<br />
2479 6 37 0.00% 3472 112 675 0.08%<br />
2480 485 2,912 0.36% 3473 1 9 0.00%<br />
2481 1,054 6,323 0.79% 3474 695 4,172 0.52%<br />
2482 1,490 8,941 1.12% 3475 142 851 0.11%<br />
2579 104 621 0.08% 3476 7,092 42,553 5.32%<br />
2580 192 1,153 0.14% 3477 972 5,835 0.73%<br />
2679 347 2,084 0.26% 3571 14 87 0.01%<br />
2680 24 145 0.02% 3572 242 1,451 0.18%<br />
2779 210 1,257 0.16% 3573 59 355 0.04%<br />
2780 450 2,698 0.34% 3574 2,821 16,929 2.12%<br />
2878 13 80 0.01% 3575 98 591 0.07%<br />
2879 1,198 7,187 0.90% 3576 1 3 0.00%<br />
2880 5,813 34,880 4.36% 3674 3 16 0.00%<br />
2978 39 235 0.03% 799,207<br />
2979 253 1,520 0.19%<br />
2980 23,489 140,932 17.63%<br />
2981 499 2,995 0.37%<br />
3076 89 535 0.07%<br />
3079 1,333 8,000 1.00%<br />
3080 33,068 198,408 24.83%<br />
3081 5,282 31,694 3.97%<br />
3174 2 13 0.00%<br />
3175 28 167 0.02%<br />
3177 411 2,467 0.31%<br />
3178 550 3,299 0.41%<br />
3179 11,234 67,402 8.43%<br />
3180 6,469 38,816 4.86%<br />
3181 31 189 0.02%<br />
3275 5 32 0.00%<br />
3276 101 606 0.08%<br />
3277 334 2,005 0.25%<br />
3278 13,375 80,250 10.04%<br />
3279 10,221 61,327 7.67%<br />
3280 781 4,684 0.59%<br />
3372 11 66 0.01%<br />
3374 27 164 0.02%<br />
3375 132 789 0.10%<br />
3376 556 3,334 0.42%<br />
3377 3,767 22,604 2.83%<br />
3378 9,494 56,963 7.13%<br />
3379 231 1,385 0.17%<br />
3471 1 9 0.00%<br />
37
2.4.2 Headboat<br />
Table 53. Headboat landings (pounds whole weight) of red snapper by area code 2001-<br />
2006. Shaded area represents locations where 74% of the red snapper were caught.<br />
Area<br />
Code Description Average<br />
2001-<br />
2006 Percentage<br />
3<br />
CAPE FEAR, NC (OFFSHORE)<br />
TOPSAIL ISLAND - OCEAN ISLE<br />
BEACH, NC 1,957 11,742 3.25%<br />
4 SOUTH CAROLINA (INSHORE) 1,409 8,454 2.34%<br />
5 SOUTH CAROLINA (OFFSHORE) 12,660 75,962 21.04%<br />
6 GEORGIA 5,627 33,759 9.35%<br />
7<br />
FERNANDINA BEACH -ST.<br />
AUGUSTINE, FL 14,250 85,498 23.68%<br />
8 DAYTONA BEACH - SEBASTIAN, FL 17,375 104,250 28.88%<br />
9<br />
CAPE LOOKOUT (INSHORE)<br />
MOREHEAD CITY - SNEADS FERRY,<br />
NC 44 262 0.07%<br />
10<br />
CAPE LOOKOUT (OFFSHORE)<br />
MOREHEAD CITY - SNEADS FERRY,<br />
NC 4,878 29,268 8.11%<br />
11 FORT PIERCE - MIAMI, FL 1,706 10,238 2.84%<br />
12 KEY LARGO - KEY WEST, FL 135 807 0.22%<br />
17<br />
DRY TORTUGAS, FLORIDA (Vessels<br />
docked in FL Keys) 127 760 0.21%<br />
361,000<br />
38
2.4.3 MRFSS<br />
Table 54. Locations where red snapper where caught during 2001-2005. Represents<br />
sample and not adjusted for effort. Shaded area represents locations where 69% of the<br />
red snapper were taken.<br />
East FL<br />
Counties<br />
unadjusted<br />
number percent<br />
Dade 3.17 0.61%<br />
Broward 0 0.00%<br />
Palm Beach 2.7 0.52%<br />
Martin 4.75 0.92%<br />
St. Lucie 6.88 1.33%<br />
Indian<br />
River 7.67 1.49%<br />
Brevard 59.1 11.45%<br />
Volusia 123.03 23.83%<br />
St. Johns 58.87 11.40%<br />
Duval 61.1 11.84%<br />
Nassau 4.53 0.88%<br />
Georgia<br />
unadjusted<br />
number percent<br />
Bryan 0 0.00%<br />
Camden 1 0.19%<br />
Clay 45.9 8.89%<br />
Glynn 14.48 2.80%<br />
Early 0.2 0.04%<br />
McIntosh 0 0.00%<br />
South<br />
Carolina<br />
unadjusted<br />
number percent<br />
Beaufort 5 0.97%<br />
Charleston 5.85 1.13%<br />
Georgetown 53.27 10.32%<br />
Horry 16.33 3.16%<br />
North<br />
Carolina<br />
unadjusted<br />
number percent<br />
Brunswick 1.53 0.30%<br />
Carteret 35.47 6.87%<br />
Dare 0.5 0.10%<br />
Davie 4.9 0.95%<br />
516.23<br />
39
3 Commercial Trip Limit Analysis<br />
Table 55. Trip limit analysis for red snapper data from 2001-2006.<br />
Avg 2001-2006<br />
Trip Limit<br />
(lbs gutted<br />
weight)<br />
%<br />
reduction<br />
in catch<br />
from<br />
limit<br />
Avg no.<br />
trips<br />
Avg pounds<br />
over limit<br />
Expected<br />
catch<br />
% trips<br />
over limit<br />
0 1,751.2 148,689 0 100.0% 100.0%<br />
23 1,028.7 113,738 34,952 58.7% 76.5%<br />
45 689.5 92,679 56,010 39.4% 62.3%<br />
68 505.7 77,849 70,840 28.9% 52.4%<br />
90 386.7 66,826 81,863 22.1% 44.9%<br />
135 256.7 51,019 97,671 14.7% 34.3%<br />
225 136.8 32,205 116,484 7.8% 21.7%<br />
270 102.7 26,241 122,448 5.9% 17.6%<br />
450 41.3 12,926 135,763 2.4% 8.7%<br />
541 26.7 9,568 139,122 1.5% 6.4%<br />
631 17.7 7,329 141,360 1.0% 4.9%<br />
721 12.7 5,805 142,885 0.7% 3.9%<br />
811 9.8 4,675 144,014 0.6% 3.1%<br />
901 7.7 3,793 144,896 0.4% 2.6%<br />
991 5.8 3,145 145,544 0.3% 2.1%<br />
1,081 4.3 2,650 146,039 0.2% 1.8%<br />
1,171 3.3 2,278 146,411 0.2% 1.5%<br />
1,261 2.8 1,965 146,724 0.2% 1.3%<br />
1,351 2.2 1,732 146,957 0.1% 1.2%<br />
1,441 1.8 1,533 147,156 0.1% 1.0%<br />
1,532 1.8 1,350 147,339 0.1% 0.9%<br />
1,622 1.5 1,193 147,496 0.1% 0.8%<br />
1,712 1.2 1,048 147,641 0.1% 0.7%<br />
1,802 1.2 932 147,758 0.1% 0.6%<br />
2,027 0.8 695 147,994 0.0% 0.5%<br />
2,252 0.5 513 148,177 0.0% 0.3%<br />
2,477 0.3 394 148,296 0.0% 0.3%<br />
2,703 0.3 310 148,379 0.0% 0.2%<br />
2,928 0.2 258 148,431 0.0% 0.2%<br />
3,153 0.2 217 148,472 0.0% 0.1%<br />
3,378 0.2 175 148,514 0.0% 0.1%<br />
3,604 0.2 133 148,556 0.0% 0.1%<br />
3,829 0.2 92 148,597 0.0% 0.1%<br />
4,054 0.2 50 148,639 0.0% 0.0%<br />
4,279 0.2 8 148,681 0.0% 0.0%<br />
4,505 0.0 0 148,689 0.0% 0.0%<br />
40
4 SPECIES DESCRIPTIONS OF RED SNAPPER<br />
The red snapper is found from North<br />
Carolina to the Florida Keys, and throughout<br />
the Gulf of Mexico to the Yucatan (Robins<br />
and Ray 1986). It can be found at depths<br />
from 10 to 190 m (33-623 ft). Adults<br />
usually occur over rocky bottoms. Juveniles<br />
inhabit shallow waters and are common over<br />
sandy or muddy bottom habitat (Allen<br />
1985).<br />
© Duane Raver<br />
The maximum size reported for this species is 100 cm (39.7 in) TL (Allen 1985, Robins<br />
and Ray 1986) and 22.8 kg (50 lbs) (Allen 1985). Maximum reported age in the Gulf of<br />
Mexico is reported as 53 years by Goodyear (1995) and 57 years by Allman et al. (2002).<br />
For samples collected from North Carolina to eastern Florida, maximum reported age is<br />
45 years (White and Palmer 2004). McInerny (2007) reports a maximum age of 54 years<br />
red snapper in the South Atlantic. Natural mortality (M) is estimated to be 0.078 using<br />
the Hoenig (1983) method with a maximum age of 53 years (SEDAR 15 2008).<br />
Manooch et al. (1998) estimated M at 0.25 but the maximum age in their study was 25<br />
years (Manooch and Potts 1997).<br />
<strong>Red</strong> snapper are gonochorists. In the U.S. South Atlantic Bight and in the Gulf of<br />
Mexico, Grimes (1987) reported that size at first maturity is 23.7 cm (9.3 in) FL. For red<br />
snapper collected along the Southeastern United States, White and Palmer (2004) found<br />
that the smallest mature male was 20.0 cm (7.9 in) TL, and the largest immature male<br />
was 37.8 cm (15 in) TL. 50% of males are mature at 22.3 cm (8.8 in) TL, while 50% of<br />
females are mature at 37.8 cm (15 in) TL. Males are present in 86% of age 1, 91% of age<br />
2, 100% of age 3, 98% of age 4, and 100% of older age fish. Mature females are present<br />
in 0% of age 1, 53% of age 2, 92% of age 3, 96% of age 4, and 100% of older age<br />
individuals. Grimes (1987) found that the spawning season of this species varies with<br />
location, but in most cases occurs nearly year round. White and Palmer (2004) reported<br />
that the spawning season for female red snapper off the southeastern United States<br />
extends from May to October, peaking in July through September. <strong>Red</strong> snapper eat<br />
fishes, shrimps, crabs, worms, cephalopods, and some planktonic items (Szedlemayr and<br />
Lee 2004).<br />
41
5 References<br />
Allen, G.R. 1985. FAO species catalogue. Vol. 6. <strong>Snapper</strong>s of the world. An annotated<br />
and illustrated catalogue of lutjanid species known to date. FAO Fish. Synop.<br />
6(125):208 p.<br />
Goodyear, C.P., 1995. <strong>Red</strong> snapper in U.S. waters of the Gulf of Mexico. NOAA<br />
Contribution: MIA-95/96-05.<br />
Grimes, C.B. 1987. Reproductive biology of the Lutjanidae: a review. Pages 239-294 In<br />
J.J. Polovina and S. Ralston (eds.) Tropical snappers and groupers: biology and<br />
fisheries management. Westview Press. Boulder, Colorado.<br />
Hoenig, J.M. 1983. Empirical use of longevity data to estimate mortality rates. Fish.<br />
Bull. 82: 898-903.<br />
Manooch, C.S., III and J.C. Potts. 1997. Age and growth of red snapper, Lutjanus<br />
campechanus, Lutjanidae, collected along the southeastern United States from<br />
North Carolina through the East Coast of Florida. J. Elisha Mitchell 113:111-122.<br />
Manooch, C.S., III, J.C. Potts, D.S. Vaughan, and M.L. Burton. 1998. Population<br />
assessment of the red snapper, Lutjanus campechanus, from the southeastern<br />
United States. Report prepared for the South Atlantic Fisheries <strong>Management</strong><br />
Council. One Southpark Circle, Suite 306, Charleston, SC, April 1997, 84 pp.<br />
McInerny, S. 2007. Age and growth of red snapper, Lutjanus campechanus, from the<br />
southeastern United States. Master Thesis, University of North Carolina<br />
Wilmington.<br />
Robins, C.R. and G.C. Ray. 1986. A field guide to Atlantic coast fishes of North<br />
America. Houghton Mifflin Company, Boston, U.S.A. 354 p.<br />
SEDAR 15. 2008. Stock assessment Report 1 (SAR 1) South Atlantic red snapper.<br />
SEDAR Offices, The South Atlantic Fishery <strong>Management</strong> Council, 4055 Faber<br />
Place #201, North Charleston, SC 29405.<br />
Szedlmayer, S.T. and J.D. Lee. 2004. Diet shifts of juvenile red snapper (Lutjanus<br />
campechanus) with changes in habitat and fish size. Fish. Bull. 102:366–375<br />
(2004).<br />
White, D.B. and S.M. Palmer. 2004. Age, growth, and reproduction of the red snapper,<br />
Lutjanus campechanus, from the Atlantic Waters of the Southeastern U. S. Bull.<br />
Mar. Sci. 75: 335-360.<br />
42