
Create successful ePaper yourself
Turn your PDF publications into a flip-book with our unique Google optimized e-Paper software.
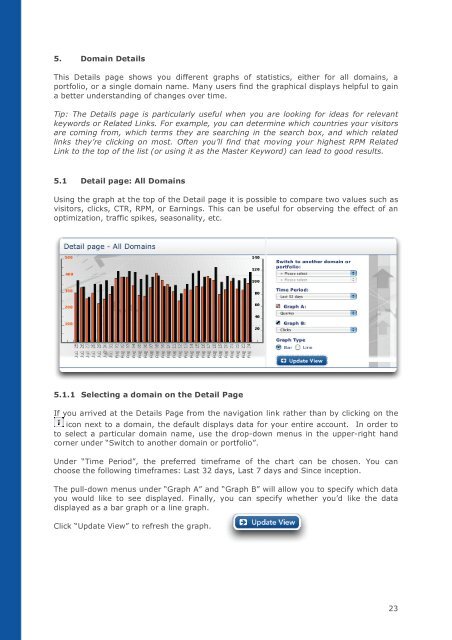
5. Domain Details<br />
This Details page shows you different graphs of statistics, either for all domains, a<br />
portfolio, or a single domain name. Many users find the graphical displays helpful to gain<br />
a better understanding of changes over time.<br />
Tip: The Details page is particularly useful when you are looking for ideas for relevant<br />
keywords or Related Links. For example, you can determine which countries your visitors<br />
are coming from, which terms they are searching in the search box, and which related<br />
links they’re clicking on most. Often you’ll find that moving your highest RPM Related<br />
Link to the top of the list (or using it as the Master Keyword) can lead to good results.<br />
5.1 Detail page: All Domains<br />
Using the graph at the top of the Detail page it is possible to compare two values such as<br />
visitors, clicks, CTR, RPM, or Earnings. This can be useful for observing the effect of an<br />
optimization, traffic spikes, seasonality, etc.<br />
5.1.1 Selecting a domain on the Detail Page<br />
If you arrived at the Details Page from the navigation link rather than by clicking on the<br />
icon next to a domain, the default displays data for your entire account. In order to<br />
to select a particular domain name, use the drop-down menus in the upper-right hand<br />
corner under “Switch to another domain or portfolio”.<br />
Under “Time Period”, the preferred timeframe of the chart can be chosen. You can<br />
choose the following timeframes: Last 32 days, Last 7 days and Since inception.<br />
The pull-down menus under “Graph A” and “Graph B” will allow you to specify which data<br />
you would like to see displayed. Finally, you can specify whether you’d like the data<br />
displayed as a bar graph or a line graph.<br />
Click “Update View” to refresh the graph.<br />
23