A spectrogram for the twenty-first century.
A spectrogram for the twenty-first century.
A spectrogram for the twenty-first century.

You also want an ePaper? Increase the reach of your titles
YUMPU automatically turns print PDFs into web optimized ePapers that Google loves.
A SPECTROGRAM FOR THE TWENTY-FIRST CENTURY<br />
Sean A. Fulop<br />
Department of Linguistics, Cali<strong>for</strong>nia State University, Fresno<br />
Fresno, Cali<strong>for</strong>nia 93740<br />
Kelly Fitz<br />
School of Electrical Engineering and Computer Science, Washington State University<br />
Pullman, Washington 99164<br />
Just as World War II was breaking<br />
out in Europe in 1939, a prototype<br />
of a remarkable electrical device<br />
was being completed at Bell Telephone<br />
Laboratories, under <strong>the</strong> direction of<br />
Ralph Potter. This device was able to<br />
provide, on a strip of paper, a continuous<br />
running document of <strong>the</strong> Fourier<br />
spectrum of a sound signal as it<br />
changed through time. Because of <strong>the</strong><br />
war it was kept under wraps, but its<br />
detailed construction and numerous<br />
applications were revealed to <strong>the</strong> scientific<br />
community in a series of papers<br />
published in <strong>the</strong> Journal of <strong>the</strong><br />
Acoustical Society of America (JASA) in<br />
1946, 1,2 wherein it was called <strong>the</strong><br />
Sound Spectrograph. The running<br />
spectral analysis that it output was<br />
termed a <strong>spectrogram</strong>.<br />
The spectrograph has been recorded<br />
in history as one of <strong>the</strong> most useful<br />
and influential instruments <strong>for</strong> acoustic<br />
signal processing. In particular, <strong>the</strong><br />
fields of phonetics and speech communication,<br />
which motivated <strong>the</strong> development<br />
of <strong>the</strong> machine, have been completely<br />
trans<strong>for</strong>med by its widespread<br />
adoption. Over <strong>the</strong> decades, <strong>the</strong> cumbersome<br />
and delicate analog spectrograph<br />
hardware was trans<strong>for</strong>med into<br />
more robust digital hardware at <strong>first</strong>,<br />
and <strong>the</strong>n as computers became generally<br />
more powerful, into <strong>the</strong> digital software<br />
incarnations most of us use today.<br />
The underlying principle of <strong>the</strong> <strong>spectrogram</strong><br />
has never changed; most applied<br />
acousticians who do time-frequency<br />
analysis are content to use software that<br />
in essence simulates <strong>the</strong> output that<br />
appeared 60 years ago in JASA (Fig. 1).<br />
Of what else in acoustics can <strong>the</strong> same<br />
be said? Do we use 60-year old microphones?<br />
Tape recorders? Loudspeakers?<br />
Well, in truth, some of us have not<br />
been so content, but a more useful analytical<br />
process has never been generally<br />
recognized. The rich area of signal pro-<br />
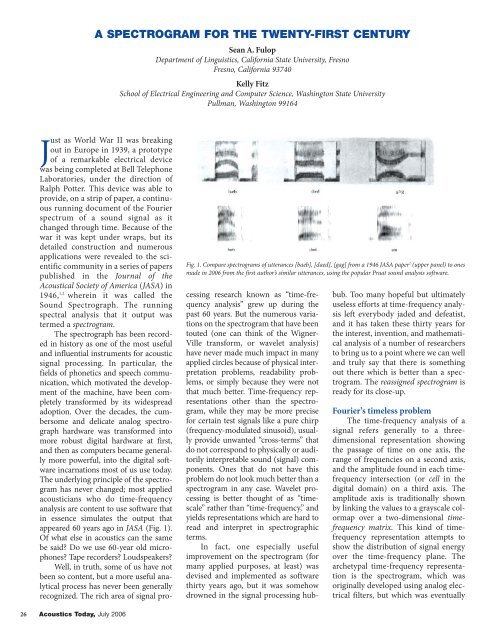
Fig. 1. Compare <strong>spectrogram</strong>s of utterances [baeb], [daed], [gag] from a 1946 JASA paper 2 (upper panel) to ones<br />
made in 2006 from <strong>the</strong> <strong>first</strong> author’s similar utterances, using <strong>the</strong> popular Praat sound analysis software.<br />
cessing research known as “time-frequency<br />
analysis” grew up during <strong>the</strong><br />
past 60 years. But <strong>the</strong> numerous variations<br />
on <strong>the</strong> <strong>spectrogram</strong> that have been<br />
touted (one can think of <strong>the</strong> Wigner-<br />
Ville trans<strong>for</strong>m, or wavelet analysis)<br />
have never made much impact in many<br />
applied circles because of physical interpretation<br />
problems, readability problems,<br />
or simply because <strong>the</strong>y were not<br />
that much better. Time-frequency representations<br />
o<strong>the</strong>r than <strong>the</strong> <strong>spectrogram</strong>,<br />
while <strong>the</strong>y may be more precise<br />
<strong>for</strong> certain test signals like a pure chirp<br />
(frequency-modulated sinusoid), usually<br />
provide unwanted “cross-terms” that<br />
do not correspond to physically or auditorily<br />
interpretable sound (signal) components.<br />
Ones that do not have this<br />
problem do not look much better than a<br />
<strong>spectrogram</strong> in any case. Wavelet processing<br />
is better thought of as “timescale”<br />
ra<strong>the</strong>r than “time-frequency,” and<br />
yields representations which are hard to<br />
read and interpret in spectrographic<br />
terms.<br />
In fact, one especially useful<br />
improvement on <strong>the</strong> <strong>spectrogram</strong> (<strong>for</strong><br />
many applied purposes, at least) was<br />
devised and implemented as software<br />
thirty years ago, but it was somehow<br />
drowned in <strong>the</strong> signal processing hubbub.<br />
Too many hopeful but ultimately<br />
useless ef<strong>for</strong>ts at time-frequency analysis<br />
left everybody jaded and defeatist,<br />
and it has taken <strong>the</strong>se thirty years <strong>for</strong><br />
<strong>the</strong> interest, invention, and ma<strong>the</strong>matical<br />
analysis of a number of researchers<br />
to bring us to a point where we can well<br />
and truly say that <strong>the</strong>re is something<br />
out <strong>the</strong>re which is better than a <strong>spectrogram</strong>.<br />
The reassigned <strong>spectrogram</strong> is<br />
ready <strong>for</strong> its close-up.<br />
Fourier’s timeless problem<br />
The time-frequency analysis of a<br />
signal refers generally to a threedimensional<br />
representation showing<br />
<strong>the</strong> passage of time on one axis, <strong>the</strong><br />
range of frequencies on a second axis,<br />
and <strong>the</strong> amplitude found in each timefrequency<br />
intersection (or cell in <strong>the</strong><br />
digital domain) on a third axis. The<br />
amplitude axis is traditionally shown<br />
by linking <strong>the</strong> values to a grayscale colormap<br />
over a two-dimensional timefrequency<br />
matrix. This kind of timefrequency<br />
representation attempts to<br />
show <strong>the</strong> distribution of signal energy<br />
over <strong>the</strong> time-frequency plane. The<br />
archetypal time-frequency representation<br />
is <strong>the</strong> <strong>spectrogram</strong>, which was<br />
originally developed using analog electrical<br />
filters, but which was eventually<br />
26 Acoustics Today, July 2006