

Tamil Nadu 2003 - of Planning Commission
Tamil Nadu 2003 - of Planning Commission
Tamil Nadu 2003 - of Planning Commission

Create successful ePaper yourself
Turn your PDF publications into a flip-book with our unique Google optimized e-Paper software.
EMPLOYMENT, INCOME AND POVERTY ✦ 27<br />
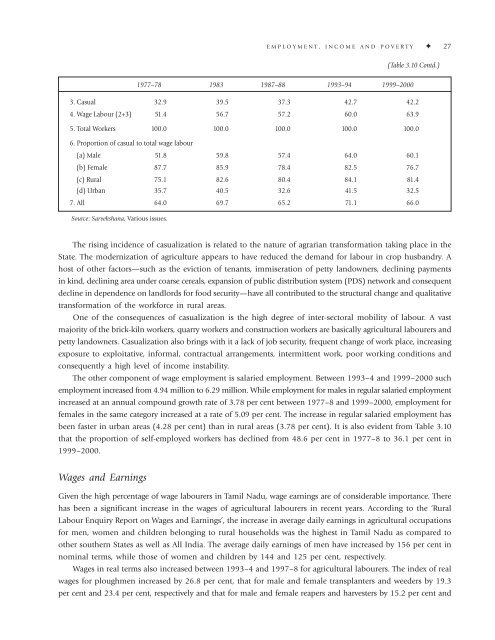
(Table 3.10 Contd.)<br />
1977–78 1983 1987–88 1993–94 1999–2000<br />
3. Casual 32.9 39.5 37.3 42.7 42.2<br />
4. Wage Labour (2+3) 51.4 56.7 57.2 60.0 63.9<br />
5. Total Workers 100.0 100.0 100.0 100.0 100.0<br />
6. Proportion <strong>of</strong> casual to total wage labour<br />
(a) Male 51.8 59.8 57.4 64.0 60.1<br />
(b) Female 87.7 85.9 78.4 82.5 76.7<br />
(c) Rural 75.1 82.6 80.4 84.1 81.4<br />
(d) Urban 35.7 40.5 32.6 41.5 32.5<br />
7. All 64.0 69.7 65.2 71.1 66.0<br />
Source: Sarvekshana, Various issues.<br />
The rising incidence <strong>of</strong> casualization is related to the nature <strong>of</strong> agrarian transformation taking place in the<br />
State. The modernization <strong>of</strong> agriculture appears to have reduced the demand for labour in crop husbandry. A<br />
host <strong>of</strong> other factors—such as the eviction <strong>of</strong> tenants, immiseration <strong>of</strong> petty landowners, declining payments<br />
in kind, declining area under coarse cereals, expansion <strong>of</strong> public distribution system (PDS) network and consequent<br />
decline in dependence on landlords for food security—have all contributed to the structural change and qualitative<br />
transformation <strong>of</strong> the workforce in rural areas.<br />
One <strong>of</strong> the consequences <strong>of</strong> casualization is the high degree <strong>of</strong> inter-sectoral mobility <strong>of</strong> labour. A vast<br />
majority <strong>of</strong> the brick-kiln workers, quarry workers and construction workers are basically agricultural labourers and<br />
petty landowners. Casualization also brings with it a lack <strong>of</strong> job security, frequent change <strong>of</strong> work place, increasing<br />
exposure to exploitative, informal, contractual arrangements, intermittent work, poor working conditions and<br />
consequently a high level <strong>of</strong> income instability.<br />
The other component <strong>of</strong> wage employment is salaried employment. Between 1993–4 and 1999–2000 such<br />
employment increased from 4.94 million to 6.29 million. While employment for males in regular salaried employment<br />
increased at an annual compound growth rate <strong>of</strong> 3.78 per cent between 1977–8 and 1999–2000, employment for<br />
females in the same category increased at a rate <strong>of</strong> 5.09 per cent. The increase in regular salaried employment has<br />
been faster in urban areas (4.28 per cent) than in rural areas (3.78 per cent). It is also evident from Table 3.10<br />
that the proportion <strong>of</strong> self-employed workers has declined from 48.6 per cent in 1977–8 to 36.1 per cent in<br />
1999–2000.<br />
Wages and Earnings<br />
Given the high percentage <strong>of</strong> wage labourers in <strong>Tamil</strong> <strong>Nadu</strong>, wage earnings are <strong>of</strong> considerable importance. There<br />
has been a significant increase in the wages <strong>of</strong> agricultural labourers in recent years. According to the ‘Rural<br />
Labour Enquiry Report on Wages and Earnings’, the increase in average daily earnings in agricultural occupations<br />
for men, women and children belonging to rural households was the highest in <strong>Tamil</strong> <strong>Nadu</strong> as compared to<br />
other southern States as well as All India. The average daily earnings <strong>of</strong> men have increased by 156 per cent in<br />
nominal terms, while those <strong>of</strong> women and children by 144 and 125 per cent, respectively.<br />
Wages in real terms also increased between 1993–4 and 1997–8 for agricultural labourers. The index <strong>of</strong> real<br />
wages for ploughmen increased by 26.8 per cent, that for male and female transplanters and weeders by 19.3<br />
per cent and 23.4 per cent, respectively and that for male and female reapers and harvesters by 15.2 per cent and


