

Accenture-Circular-Advantage-Innovative-Business-Models-Technologies-Value-Growth
Accenture-Circular-Advantage-Innovative-Business-Models-Technologies-Value-Growth
Accenture-Circular-Advantage-Innovative-Business-Models-Technologies-Value-Growth

You also want an ePaper? Increase the reach of your titles
YUMPU automatically turns print PDFs into web optimized ePapers that Google loves.
The Trouble with the Prevailing <strong>Growth</strong> Model<br />
There are volumes of research that<br />
highlight the problem of increasing<br />
resource scarcity and mounting waste. 9<br />
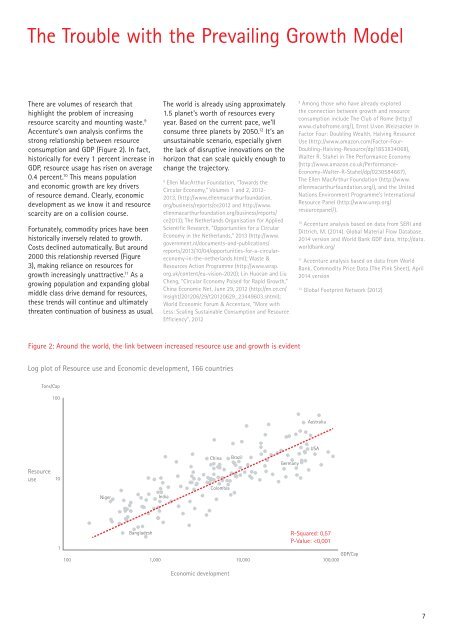
<strong>Accenture</strong>’s own analysis confirms the<br />
strong relationship between resource<br />
consumption and GDP (Figure 2). In fact,<br />
historically for every 1 percent increase in<br />
GDP, resource usage has risen on average<br />
0.4 percent. 10 This means population<br />
and economic growth are key drivers<br />
of resource demand. Clearly, economic<br />
development as we know it and resource<br />
scarcity are on a collision course.<br />
Fortunately, commodity prices have been<br />
historically inversely related to growth.<br />
Costs declined automatically. But around<br />
2000 this relationship reversed (Figure<br />
3), making reliance on resources for<br />
growth increasingly unattractive. 11 As a<br />
growing population and expanding global<br />
middle class drive demand for resources,<br />
these trends will continue and ultimately<br />
threaten continuation of business as usual.<br />
The world is already using approximately<br />
1.5 planet’s worth of resources every<br />
year. Based on the current pace, we’ll<br />
consume three planets by 2050. 12 It’s an<br />
unsustainable scenario, especially given<br />
the lack of disruptive innovations on the<br />
horizon that can scale quickly enough to<br />
change the trajectory.<br />
8<br />
Ellen MacArthur Foundation, “Towards the<br />
<strong>Circular</strong> Economy,” Volumes 1 and 2, 2012-<br />
2013, (http://www.ellenmacarthurfoundation.<br />
org/business/reports/ce2012 and http://www.<br />
ellenmacarthurfoundation.org/business/reports/<br />
ce2013); The Netherlands Organisation for Applied<br />
Scientific Research, “Opportunities for a <strong>Circular</strong><br />
Economy in the Netherlands,” 2013 (http://www.<br />
government.nl/documents-and-publications/<br />
reports/2013/10/04/opportunities-for-a-circulareconomy-in-the-netherlands.html);<br />
Waste &<br />
Resources Action Programme (http://www.wrap.<br />
org.uk/content/eu-vision-2020); Lin Huocan and Liu<br />
Cheng, “<strong>Circular</strong> Economy Poised for Rapid <strong>Growth</strong>,”<br />
China Economic Net, June 29, 2012 (http://en.ce.cn/<br />
Insight/201206/29/t20120629_23449603.shtml);<br />
World Economic Forum & <strong>Accenture</strong>, “More with<br />
Less: Scaling Sustainable Consumption and Resource<br />
Efficiency”, 2012<br />
9<br />
Among those who have already explored<br />
the connection between growth and resource<br />
consumption include The Club of Rome (http://<br />
www.clubofrome.org/), Ernst U.von Weizsacker in<br />
Factor Four: Doubling Wealth, Halving Resource<br />
Use (http://www.amazon.com/Factor-Four-<br />
Doubling-Halving-Resource/dp/1853834068),<br />
Walter R. Stahel in The Performance Economy<br />
(http://www.amazon.co.uk/Performance-<br />
Economy-Walter-R-Stahel/dp/0230584667),<br />
The Ellen MacArthur Foundation (http://www.<br />
ellenmacarthurfoundation.org/), and the United<br />
Nations Environment Programme’s International<br />
Resource Panel (http://www.unep.org/<br />
resourcepanel/).<br />
10<br />
<strong>Accenture</strong> analysis based on data from SERI and<br />
Dittrich, M. (2014). Global Material Flow Database.<br />
2014 version and World Bank GDP data, http://data.<br />
worldbank.org/<br />
11<br />
<strong>Accenture</strong> analysis based on data from World<br />
Bank, Commodity Price Data (The Pink Sheet), April<br />
2014 version<br />
12<br />
Global Footprint Network (2012)<br />
Figure 2: Around the world, the link between increased resource use and growth is evident<br />
Log plot of Resource use and Economic development, 166 countries<br />
Tons/Cap<br />
100<br />
Australia<br />
USA<br />
Resource<br />
use<br />
10<br />
Niger<br />
India<br />
China<br />
Colombia<br />
Brazil<br />
Germany<br />
1<br />
Bangladesh<br />
R-Squared: 0,57<br />
P-<strong>Value</strong>: