India: The Other Asian Giant - CoBank
India: The Other Asian Giant - CoBank
India: The Other Asian Giant - CoBank

You also want an ePaper? Increase the reach of your titles
YUMPU automatically turns print PDFs into web optimized ePapers that Google loves.
Interest Rates and<br />
Economic Indicators<br />
<strong>The</strong> interest rate and economic data on this page were updated as<br />
of 07/31/12. <strong>The</strong>y are intended to provide rate or cost indications<br />
only and are for notional amounts in excess of $5 million except for<br />
forward fixed rates.<br />
KEY ECONOMIC INDICATORS<br />
Gross Domestic Product (GDP) measures the change in total output of the<br />
U.S. economy. <strong>The</strong> Consumer Price Index (CPI) is a measure of consumer<br />
inflation. <strong>The</strong> federal funds rate is the rate charged by banks to one another<br />
on overnight funds. <strong>The</strong> target federal funds rate is set by the Federal Reserve<br />
as one of the tools of monetary policy. <strong>The</strong> interest rate on the 10-year U.S.<br />
Treasury Note is considered a reflection of the market’s view of longer-term<br />
macroeconomic performance; the 2-year projection provides a view of more<br />
near-term economic performance.<br />
ECONOMIC AND INTEREST RATE PROJECTIONS<br />
Source: Insight Economics, LLC and Blue Chip Economic Indicators<br />
US Treasury Securities<br />
2012 GDP CPI Funds 2-year 10-year<br />
Q3 2.10% 1.40% 0.15% 0.30% 1.60%<br />
Q4 2.30% 1.80% 0.15% 0.30% 1.80%<br />
2013 GDP CPI Funds 2-year 10-year<br />
Q1 1.90% 2.10% 0.15% 0.40% 1.90%<br />
OUTLOOK www.cobank.com<br />
HEDGING THE COST OF FUTURE LOANS<br />
A forward fixed rate is a fixed loan rate on a specified balance that can<br />
be drawn on or before a predetermined future date. <strong>The</strong> table below lists<br />
the additional cost incurred today to fix a loan at a future date.<br />
FORWARD FIXED RATES<br />
Cost of Forward Funds<br />
Forward<br />
Period<br />
(Days)<br />
Average Life of Loan<br />
2-yr 3-yr 5-yr 10-yr<br />
30 5 5 5 5<br />
90 5 8 10 11<br />
180 5 10 17 19<br />
365 5 23 34 36<br />
Costs are stated in basis points per year.<br />
SHORT-TERM INTEREST RATES<br />
This graph depicts the recent history of the cost to fund floating rate loans.<br />
Three-month LIBOR is the most commonly used index for short-term financing.<br />
3-MONTH LIBOR<br />
Q2 2.40% 2.00% 0.15% 0.50% 2.10%<br />
Q3 2.70% 2.30% 0.20% 0.60% 2.20%<br />
YIELD<br />
6.00%<br />
5.00%<br />
Q4 2.90% 2.20% 0.20% 0.60% 2.30%<br />
4.00%<br />
3.00%<br />
PROJECTIONS OF FUTURE INTEREST RATES<br />
<strong>The</strong> table below reflects current market expectations about interest rates<br />
at given points in the future. Implied forward rates are the most commonly<br />
used measure of the outlook for interest rates. <strong>The</strong> forward rates listed are<br />
derived from the current interest rate curve using a mathematical formula<br />
to project future interest rate levels.<br />
2.00%<br />
1.00%<br />
0.00%<br />
1/1/06<br />
5/1/06<br />
Daily Rate<br />
30 Day Moving Avg.<br />
8/29/06<br />
12/27/06<br />
4/26/07<br />
8/24/07<br />
12/22/07<br />
4/20/08<br />
8/18/08<br />
12/16/08<br />
4/15/09<br />
8/13/09<br />
12/11/09<br />
4/10/10<br />
8/8/10<br />
12/6/10<br />
4/5/11<br />
8/3/11<br />
12/1/11<br />
3/30/12<br />
7/28/12<br />
IMPLIED FORWARD SWAP RATES<br />
Years<br />
Forward<br />
3-month<br />
LIBOR<br />
1-year<br />
Swap<br />
3-year<br />
Swap<br />
5-year<br />
Swap<br />
7-year<br />
Swap<br />
10-year<br />
Swap<br />
Today 0.45% 0.40% 0.49% 0.81% 1.20% 1.63%<br />
0.25 0.28% 0.36% 0.52% 0.88% 1.27% 1.69%<br />
0.50 0.37% 0.40% 0.58% 0.96% 1.35% 1.76%<br />
0.75 0.39% 0.42% 0.64% 1.05% 1.43% 1.82%<br />
1.00 0.41% 0.45% 0.71% 1.13% 1.51% 1.89%<br />
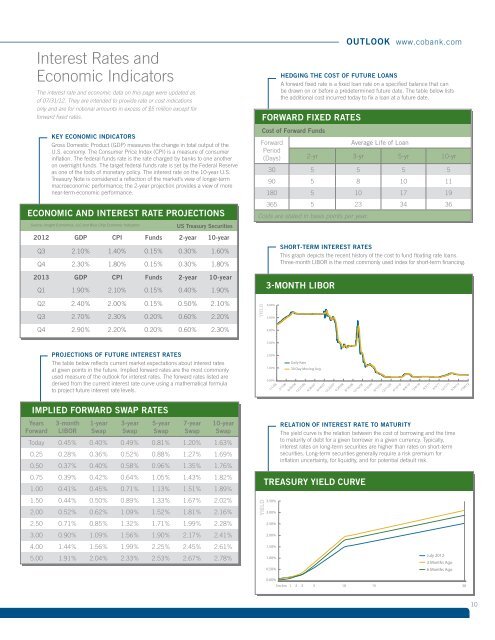
RELATION OF INTEREST RATE TO MATURITY<br />
<strong>The</strong> yield curve is the relation between the cost of borrowing and the time<br />
to maturity of debt for a given borrower in a given currency. Typically,<br />
interest rates on long-term securities are higher than rates on short-term<br />
securities. Long-term securities generally require a risk premium for<br />
inflation uncertainty, for liquidity, and for potential default risk.<br />
TREASURY YIELD CURVE<br />
1.50 0.44% 0.50% 0.89% 1.33% 1.67% 2.02%<br />
2.00 0.52% 0.62% 1.09% 1.52% 1.81% 2.16%<br />
2.50 0.71% 0.85% 1.32% 1.71% 1.99% 2.28%<br />
3.00 0.90% 1.09% 1.56% 1.90% 2.17% 2.41%<br />
4.00 1.44% 1.56% 1.99% 2.25% 2.45% 2.61%<br />
YIELD<br />
3.50%<br />
3.00%<br />
2.50%<br />
2.00%<br />
1.50%<br />
5.00 1.91% 2.04% 2.33% 2.53% 2.67% 2.78%<br />
1.00%<br />
0.50%<br />
July 2012<br />
3 Months Ago<br />
6 Months Ago<br />
0.00%<br />
3m 6m 1 2 3 5 10 15 30<br />
10