COMPARATIVE CONTEXTUAL REPORT - HWF
COMPARATIVE CONTEXTUAL REPORT - HWF
COMPARATIVE CONTEXTUAL REPORT - HWF
You also want an ePaper? Increase the reach of your titles
YUMPU automatically turns print PDFs into web optimized ePapers that Google loves.
Part One: Labour market, family and social policies 11<br />
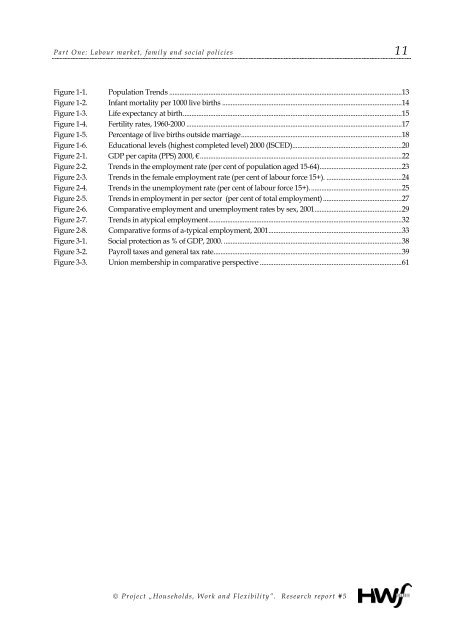
Figure 1-1. Population Trends ........................................................................................................................................13<br />
Figure 1-2. Infant mortality per 1000 live births .........................................................................................................14<br />
Figure 1-3. Life expectancy at birth................................................................................................................................15<br />
Figure 1-4. Fertility rates, 1960-2000 ..............................................................................................................................17<br />
Figure 1-5. Percentage of live births outside marriage..............................................................................................18<br />
Figure 1-6. Educational levels (highest completed level) 2000 (ISCED)................................................................20<br />
Figure 2-1. GDP per capita (PPS) 2000, €......................................................................................................................22<br />
Figure 2-2. Trends in the employment rate (per cent of population aged 15-64)................................................23<br />
Figure 2-3. Trends in the female employment rate (per cent of labour force 15+). ............................................24<br />
Figure 2-4. Trends in the unemployment rate (per cent of labour force 15+)......................................................25<br />
Figure 2-5. Trends in employment in per sector (per cent of total employment)..............................................27<br />
Figure 2-6. Comparative employment and unemployment rates by sex, 2001...................................................29<br />
Figure 2-7. Trends in atypical employment.................................................................................................................32<br />
Figure 2-8. Comparative forms of a-typical employment, 2001..............................................................................33<br />
Figure 3-1. Social protection as % of GDP, 2000. ........................................................................................................38<br />
Figure 3-2. Payroll taxes and general tax rate..............................................................................................................39<br />
Figure 3-3. Union membership in comparative perspective ...................................................................................61<br />
© Project „Households, Work and Flexibility”. Research report #5


