Solar cell efficiency tables (version 27) - ResearchGate
Solar cell efficiency tables (version 27) - ResearchGate
Solar cell efficiency tables (version 27) - ResearchGate

You also want an ePaper? Increase the reach of your titles
YUMPU automatically turns print PDFs into web optimized ePapers that Google loves.
48 M. A. GREEN ET AL.<br />
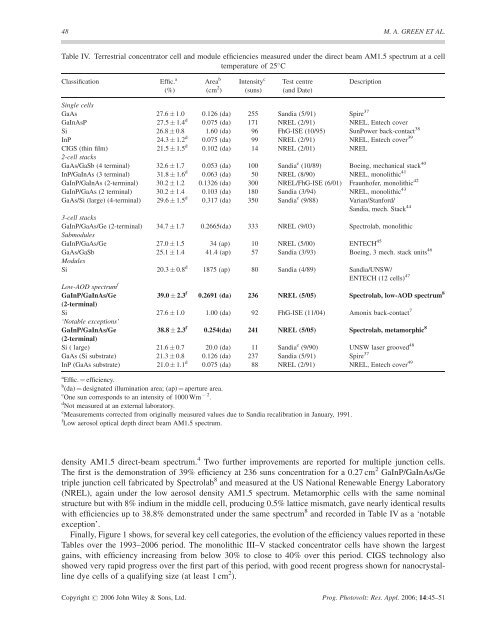
Table IV. Terrestrial concentrator <strong>cell</strong> and module efficiencies measured under the direct beam AM1.5 spectrum at a <strong>cell</strong><br />
temperature of 25 C<br />
Classification Effic. a Area b Intensity c Test centre Description<br />
(%) (cm 2 ) (suns) (and Date)<br />
Single <strong>cell</strong>s<br />
GaAs <strong>27</strong>.6 1.0 0.126 (da) 255 Sandia (5/91) Spire 37<br />
GaInAsP <strong>27</strong>.5 1.4 d 0.075 (da) 171 NREL (2/91) NREL, Entech cover<br />
Si 26.8 0.8 1.60 (da) 96 FhG-ISE (10/95) SunPower back-contact 38<br />
InP 24.3 1.2 d 0.075 (da) 99 NREL (2/91) NREL, Entech cover 39<br />
CIGS (thin film) 21.5 1.5 d 0.102 (da) 14 NREL (2/01) NREL<br />
2-<strong>cell</strong> stacks<br />
GaAs/GaSb (4 terminal) 32.6 1.7 0.053 (da) 100 Sandia e (10/89) Boeing, mechanical stack 40<br />
InP/GaInAs (3 terminal) 31.8 1.6 d 0.063 (da) 50 NREL (8/90) NREL, monolithic 41<br />
GaInP/GaInAs (2-terminal) 30.2 1.2 0.1326 (da) 300 NREL/FhG-ISE (6/01) Fraunhofer, monolithic 42<br />
GaInP/GaAs (2 terminal) 30.2 1.4 0.103 (da) 180 Sandia (3/94) NREL, monolithic 43<br />
GaAs/Si (large) (4-terminal) 29.6 1.5 d 0.317 (da) 350 Sandia e (9/88) Varian/Stanford/<br />
Sandia, mech. Stack 44<br />
3-<strong>cell</strong> stacks<br />
GaInP/GaAs/Ge (2-terminal) 34.7 1.7 0.2665(da) 333 NREL (9/03) Spectrolab, monolithic<br />
Submodules<br />
GaInP/GaAs/Ge <strong>27</strong>.0 1.5 34 (ap) 10 NREL (5/00) ENTECH 45<br />
GaAs/GaSb 25.1 1.4 41.4 (ap) 57 Sandia (3/93) Boeing, 3 mech. stack units 46<br />
Modules<br />
Si 20.3 0.8 d 1875 (ap) 80 Sandia (4/89) Sandia/UNSW/<br />
ENTECH (12 <strong>cell</strong>s) 47<br />
Low-AOD spectrum f<br />
GaInP/GaInAs/Ge 39.0 2.3 f 0.2691 (da) 236 NREL (5/05) Spectrolab, low-AOD spectrum 8<br />
(2-terminal)<br />
Si <strong>27</strong>.6 1.0 1.00 (da) 92 FhG-ISE (11/04) Amonix back-contact 7<br />
‘Notable exceptions’<br />
GaInP/GaInAs/Ge 38.8 2.3 f 0.254(da) 241 NREL (5/05) Spectrolab, metamorphic 8<br />
(2-terminal)<br />
Si ( large) 21.6 0.7 20.0 (da) 11 Sandia e (9/90) UNSW laser grooved 48<br />
GaAs (Si substrate) 21.3 0.8 0.126 (da) 237 Sandia (5/91) Spire 37<br />
InP (GaAs substrate) 21.0 1.1 d 0.075 (da) 88 NREL (2/91) NREL, Entech cover 49<br />
a Effic. ¼ <strong>efficiency</strong>.<br />
b (da) ¼ designated illumination area; (ap) ¼ aperture area.<br />
c One sun corresponds to an intensity of 1000 Wm 2 .<br />
d Not measured at an external laboratory.<br />
e Measurements corrected from originally measured values due to Sandia recalibration in January, 1991.<br />
f Low aerosol optical depth direct beam AM1.5 spectrum.<br />
density AM1.5 direct-beam spectrum. 4 Two further improvements are reported for multiple junction <strong>cell</strong>s.<br />
The first is the demonstration of 39% <strong>efficiency</strong> at 236 suns concentration for a 0.<strong>27</strong> cm 2 GaInP/GaInAs/Ge<br />
triple junction <strong>cell</strong> fabricated by Spectrolab 8 and measured at the US National Renewable Energy Laboratory<br />
(NREL), again under the low aerosol density AM1.5 spectrum. Metamorphic <strong>cell</strong>s with the same nominal<br />
structure but with 8% indium in the middle <strong>cell</strong>, producing 0.5% lattice mismatch, gave nearly identical results<br />
with efficiencies up to 38.8% demonstrated under the same spectrum 8 and recorded in Table IV as a ‘notable<br />
exception’.<br />
Finally, Figure 1 shows, for several key <strong>cell</strong> categories, the evolution of the <strong>efficiency</strong> values reported in these<br />
Tables over the 1993–2006 period. The monolithic III–V stacked concentrator <strong>cell</strong>s have shown the largest<br />
gains, with <strong>efficiency</strong> increasing from below 30% to close to 40% over this period. CIGS technology also<br />
showed very rapid progress over the first part of this period, with good recent progress shown for nanocrystalline<br />
dye <strong>cell</strong>s of a qualifying size (at least 1 cm 2 ).<br />
Copyright # 2006 John Wiley & Sons, Ltd. Prog. Photovolt: Res. Appl. 2006; 14:45–51