GLOBAL CORRUPTION BAROMETER - Asialink
GLOBAL CORRUPTION BAROMETER - Asialink
GLOBAL CORRUPTION BAROMETER - Asialink

Create successful ePaper yourself
Turn your PDF publications into a flip-book with our unique Google optimized e-Paper software.
PEOPLE’S EXPERIENCES OF <strong>CORRUPTION</strong><br />
Petty bribery by service,<br />
over time<br />
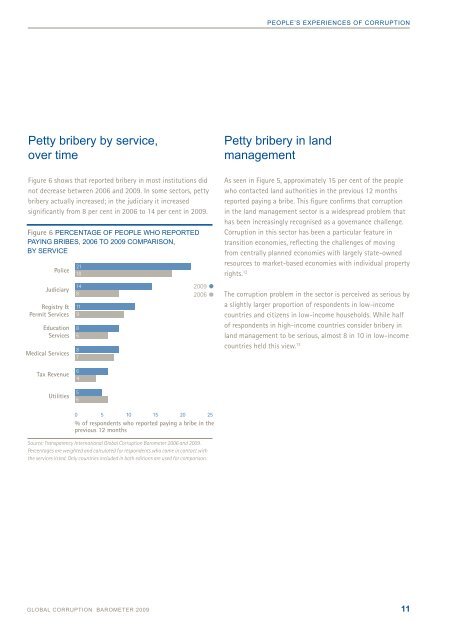
Figure 6 shows that reported bribery in most institutions did<br />
not decrease between 2006 and 2009. In some sectors, petty<br />
bribery actually increased; in the judiciary it increased<br />
significantly from 8 per cent in 2006 to 14 per cent in 2009.<br />
Figure 6 PERCENTAGE OF PEOPLE WHO REPORTED<br />
PAYING BRIBES, 2006 TO 2009 COMPARISON,<br />
BY SERVICE<br />
Police<br />
Judiciary<br />
Registry &<br />
Permit Services<br />
Education<br />
Services<br />
Medical Services<br />
21<br />
18<br />
14<br />
8<br />
11<br />
9<br />
8<br />
6<br />
8<br />
7<br />
2009<br />
2006<br />
Petty bribery in land<br />
management<br />
As seen in Figure 5, approximately 15 per cent of the people<br />
who contacted land authorities in the previous 12 months<br />
reported paying a bribe. This figure confirms that corruption<br />
in the land management sector is a widespread problem that<br />
has been increasingly recognised as a governance challenge.<br />
Corruption in this sector has been a particular feature in<br />
transition economies, reflecting the challenges of moving<br />
from centrally planned economies with largely state-owned<br />
resources to market-based economies with individual property<br />
rights. 12<br />
The corruption problem in the sector is perceived as serious by<br />
a slightly larger proportion of respondents in low-income<br />
countries and citizens in low-income households. While half<br />
of respondents in high-income countries consider bribery in<br />
land management to be serious, almost 8 in 10 in low-income<br />
countries held this view. 13<br />
Tax Revenue<br />
Utilities<br />
6<br />
4<br />
5<br />
6<br />
0 5 10 15 20 25<br />
% of respondents who reported paying a bribe in the<br />
previous 12 months<br />
Source: Transparency International Global Corruption Barometer 2006 and 2009.<br />
Percentages are weighted and calculated for respondents who came in contact with<br />
the services listed. Only countries included in both editions are used for comparison.<br />
<strong>GLOBAL</strong> <strong>CORRUPTION</strong> <strong>BAROMETER</strong> 2009 11