

early-childhood-education-report2014-eng
early-childhood-education-report2014-eng
early-childhood-education-report2014-eng

Create successful ePaper yourself
Turn your PDF publications into a flip-book with our unique Google optimized e-Paper software.
The You Bet I Care! study of Canadian child care programs<br />
concluded that physically safe environments with caring,<br />
supportive adults are the norm in the majority of centres in<br />
Canada. However, fewer than half of the preschool rooms<br />
(44.3%) and slightly more than a quarter of the infant/toddler<br />
rooms (28.7%), are also providing activities and materials that<br />
support and encourage children’s development”. 22 Stimulating<br />
environments were more likely when staff compensation and<br />
<strong>education</strong>al levels were higher, the study found. Reasonable<br />
salary and benefits, clear job responsibilities and obligations, and<br />
health and safety protections create a positive working climate<br />
for educators, which in turn create a quality setting for young<br />
children and their families.<br />
The <strong>early</strong> <strong>childhood</strong> workforce is divided along the same policy<br />
lines that influence access and funding, with the same uneven<br />
results. Certified teachers mainly work for school boards, while<br />
<strong>early</strong> <strong>childhood</strong> educators have a range of employers, including<br />
non-profit organizations, businesses and public agencies, the<br />
latter including local or provincial/territorial governments,<br />
post-secondary institutions and school boards. About 75 percent<br />
of staff working in child care and other preschool settings have<br />
a post-secondary certificate, diploma or degree, in contrast to<br />
57 percent of workers in all occupations. 23 Despite the level of<br />
formal <strong>education</strong>, child care staff, particularly those employed by<br />
community or commercial child care programs, often earn less<br />
than the average provincial wage and benefits are minimal. Only<br />
Quebec, Manitoba and Prince Edward Island provide pension plans<br />
for child care staff.<br />
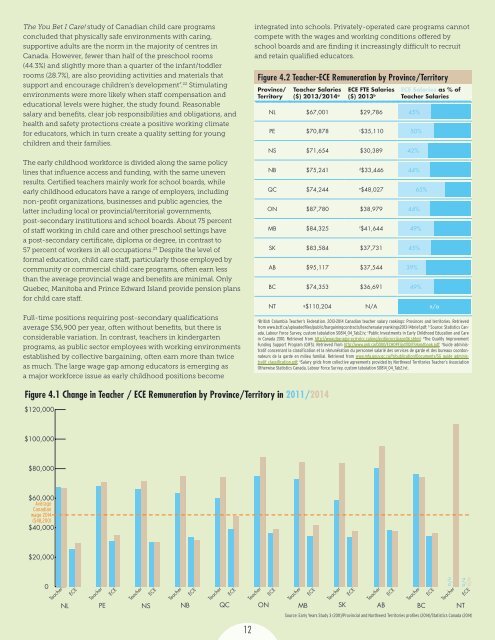
Full-time positions requiring post-secondary qualifications<br />
average $36,900 per year, often without benefits, but there is<br />
considerable variation. In contrast, teachers in kindergarten<br />
programs, as public sector employees with working environments<br />
established by collective bargaining, often earn more than twice<br />
as much. The large wage gap among educators is emerging as<br />
a major workforce issue as <strong>early</strong> <strong>childhood</strong> positions become<br />
integrated into schools. Privately-operated care programs cannot<br />
compete with the wages and working conditions offered by<br />
school boards and are finding it increasingly difficult to recruit<br />
and retain qualified educators.<br />
Figure 4.2 Teacher-ECE Remuneration by Province/Territory<br />
Province/<br />
Territory<br />
Teacher Salaries ECE FTE Salaries ECE Salaries as % of<br />
($) 2013/2014 a ($) 2013 b Teacher Salaries<br />
NL $67,001 $29,786 45%<br />
PE $70,878 c<br />
$35,110 50%<br />
NS $71,654 $30,389 42%<br />
NB $75,241 d<br />
$33,446 44%<br />
QC $74,244 e<br />
$48,027 65%<br />
ON $87,780 $38,979 44%<br />
MB $84,325 f<br />
$41,644 49%<br />
SK $83,584 $37,731 45%<br />
AB $95,117 $37,544 39%<br />
BC $74,353 $36,691 49%<br />
NT g<br />
$110,204 N/A n/a<br />
a<br />
British Columbia Teacher’s Federation. 2013-2014 Canadian teacher salary rankings: Provinces and territories. Retrieved<br />
from www.bctf.ca/uploadedfiles/public/bargainingcontracts/teachersalaryrankings2013-14brief.pdf; b Source: Statistics Canada,<br />
Labour Force Survey, custom tabulation S0814_04_Tab2.iv; c Public Investments in Early Childhood Education and Care<br />
in Canada 2010. Retrieved from http://www.dpe-agje-ecd-elcc.ca/<strong>eng</strong>/ecd/ececc/page06.shtml; d The Quality Improvement<br />
Funding Support Program (QIFS). Retrieved from http://www.gnb.ca/0000/ECHDPE/pdf/QIFSHandbook.pdf; e Guide administratif<br />
concernant la classification et la rémunération du personnel salarié des services de garde et des bureaux coordonnateurs<br />
de la garde en milieu familial. Retrieved from www.mfa.gouv.qc.ca/fr/publication/Documents/SG_guide_administratif_classification.pdf;<br />
g Salary grids from collective agreements provided by Northwest Territories Teacher’s Association<br />
Otherwise Statistics Canada, Labour Force Survey, custom tabulation S0814_04_Tab2.ivt.<br />
Figure 4.1 Change in Teacher / ECE Remuneration by Province/Territory in 2011/2014<br />
$120,000<br />
$100,000<br />
$80,000<br />
$60,000<br />
Average<br />
Canadian<br />
wage 2014<br />
($48,200)<br />
$40,000<br />
$20,000<br />
0<br />
Teacher<br />
NL<br />
ECE<br />
Teacher<br />
ECE<br />
Teacher<br />
ECE<br />
Teacher<br />
ECE<br />
Teacher<br />
ECE<br />
PE NS NB QC ON MB SK AB BC NT<br />
Source: Early Years Study 3 (2011)/Provincial and Northwest Territories profiles (2014)/Statistics Canada (2014)<br />
12<br />
Teacher<br />
ECE<br />
Teacher<br />
ECE<br />
Teacher<br />
ECE<br />
Teacher<br />
ECE<br />
Teacher<br />
ECE<br />
n/a<br />
Teacher<br />
n/a<br />
n/a<br />
ECE