to see the powerpoint presentation - Growing Up in Ireland
to see the powerpoint presentation - Growing Up in Ireland
to see the powerpoint presentation - Growing Up in Ireland
You also want an ePaper? Increase the reach of your titles
YUMPU automatically turns print PDFs into web optimized ePapers that Google loves.
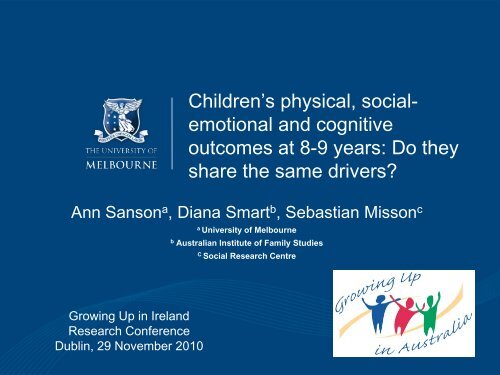
Children’s physical, socialemotional<br />
and cognitive<br />
outcomes at 8-9 years: Do <strong>the</strong>y<br />
share <strong>the</strong> same drivers?<br />
Ann Sanson a , Diana Smart b , Sebastian Misson c<br />
a<br />
University of Melbourne<br />
b<br />
Australian Institute of Family Studies<br />
C<br />
Social Research Centre<br />
<strong>Grow<strong>in</strong>g</strong> <strong>Up</strong> <strong>in</strong> <strong>Ireland</strong><br />
Research Conference<br />
Dubl<strong>in</strong>, 29 November 2010
<strong>Grow<strong>in</strong>g</strong> <strong>Up</strong> <strong>in</strong> Australia:<br />
From an idea <strong>to</strong> reality<br />
• Late 1990s: Recognition of need for national longitud<strong>in</strong>al<br />
study – lobby<strong>in</strong>g, prepara<strong>to</strong>ry work<br />
• April 2000: Fund<strong>in</strong>g announced by federal Govt - broad<br />
consultation on design and research questions<br />
• Feb 2001: Consortium formed <strong>to</strong> bid for study<br />
• August 2001: Proposal submitted<br />
• March 2002: Contract signed<br />
• 2002: Staff appo<strong>in</strong>ted<br />
• 2003: Negotiations with HIC (Medicare), contract with<br />
• data collection agency<br />
• Feb 2004: Official launch<br />
• 2004: Wave 1 completed
Feb 2004: Launch at <strong>the</strong> Children’s Museum
Family Matters 2003 - 2005
The Longitud<strong>in</strong>al Study of Australian<br />
Children (LSAC)<br />
www.aifs.gov.au/grow<strong>in</strong>gup<br />
533<br />
507<br />
Australia <strong>to</strong>tal<br />
Infants: 5,107<br />
4-5 year olds: 4,983<br />
87<br />
82<br />
347<br />
339<br />
1,251<br />
1,245<br />
1,054<br />
988<br />
113<br />
136<br />
1,615<br />
1,573<br />
ACT<br />
107<br />
113<br />
• National coverage<br />
• 10,000 children<br />
• 2 age cohorts (0-1 and 4-5 yrs)<br />
• Data waves every 2 years<br />
• Close l<strong>in</strong>k between<br />
researchers, policy-makers<br />
and service-providers<br />
• Multi-discipl<strong>in</strong>ary<br />
• Ecological model<br />
• Holistic view of children<br />
• Extensive multi-source data<br />
• Data accessible <strong>to</strong> researchers
Bronfenbrenner ‘s bio-psycho-social<br />
ecological model
Common drivers of multiple outcomes?<br />
– Analysis of 3 waves of LSAC data<br />
Questions:<br />
• Do <strong>the</strong> same fac<strong>to</strong>rs (measured at 4-5 and 6-7 years)<br />
underlie physical, social-emotional and learn<strong>in</strong>g outcomes<br />
(measured at 8-9 years)?<br />
• Does each ‘layer’ <strong>in</strong> Bronfenbrenner’s ecological model<br />
predict each outcome?<br />
• Do <strong>in</strong>ner (more proximal) layers mediate <strong>the</strong> impact of<br />
outer (more distal) layers?<br />
• Is <strong>the</strong> power of prediction from 4-5 years similar <strong>to</strong><br />
prediction from 6-7 years?<br />
• What predic<strong>to</strong>rs are common <strong>to</strong> all outcomes, and which<br />
are specific <strong>to</strong> one outcome?<br />
• Implications?
Common drivers?<br />
Current evidence base:<br />
• High co-occurrence of problems<br />
• Evidence of ‘multif<strong>in</strong>ality’: same risk and protective fac<strong>to</strong>rs/processes<br />
underlie multiple problems<br />
• Durlak (1998): identified common fac<strong>to</strong>rs addressed <strong>in</strong> prevention<br />
programs for a wide range of adolescent problems.<br />
LSAC provides opportunity <strong>to</strong> exam<strong>in</strong>e assertions <strong>in</strong> earlier<br />
childhood, with<strong>in</strong> one study, and with longitud<strong>in</strong>al data
LSAC’s Conceptual Framework<br />
• Ecological and holistic model of children’s<br />
development:<br />
‘<strong>the</strong> acquisition and growth of <strong>the</strong> physical,<br />
cognitive, social and emotional competencies<br />
required <strong>to</strong> engage fully <strong>in</strong> family and society’<br />
(Aber et al. 1997)<br />
• Child’s current developmental status on:<br />
• Health<br />
• Physical development<br />
• Emotional wellbe<strong>in</strong>g<br />
• Social development<br />
• Learn<strong>in</strong>g and academic competency
LSAC Outcome Index:<br />
Rationale and Purpose<br />
• LSAC has complex data on multiple aspects of<br />
children’s development<br />
• LSAC has multiple data users, not all experts<br />
• Outcome Index designed <strong>to</strong> be simple, user-friendly<br />
summary of children’s development<br />
• A <strong>to</strong>ol for communicat<strong>in</strong>g o<strong>the</strong>rwise complex f<strong>in</strong>d<strong>in</strong>gs<br />
for policy-makers, <strong>the</strong> media and general public<br />
• Criteria for measures <strong>in</strong>cluded <strong>in</strong> Outcome Index:<br />
• High response rate<br />
• Reliable<br />
• Provide a good coverage of doma<strong>in</strong> of <strong>in</strong>terest<br />
• Distribution giv<strong>in</strong>g good discrim<strong>in</strong>ation
Outcome Index - Broad Structure<br />
LSAC Outcome<br />
Index<br />
Physical Doma<strong>in</strong><br />
Social/Emotional<br />
Doma<strong>in</strong><br />
Learn<strong>in</strong>g Doma<strong>in</strong><br />
Health<br />
Mo<strong>to</strong>r Skills<br />
Language and<br />
Literacy<br />
Numeracy and<br />
Cognition<br />
Social Competence<br />
Internalis<strong>in</strong>g<br />
Externalis<strong>in</strong>g
Calculation of <strong>the</strong> Outcome Index<br />
1. Outcome variables standardised<br />
2. Sub-doma<strong>in</strong> scores calculated (mean of contribut<strong>in</strong>g variables)<br />
and standardised<br />
3. Doma<strong>in</strong> scores calculated (mean of contribut<strong>in</strong>g sub-doma<strong>in</strong>s) and<br />
standardised (X=100, SD=10)<br />
4. Overall Outcome Index calculated (mean of doma<strong>in</strong> scores)<br />
Also available:<br />
Cut-off scores <strong>to</strong> identify those do<strong>in</strong>g well (<strong>to</strong>p 15%) and poorly (bot<strong>to</strong>m 15%)<br />
Categorical Positive and Negative Outcome Indices – number of doma<strong>in</strong>s<br />
<strong>in</strong> which child scores above positive cut-off (0-3) or below negative cut-off<br />
(0-3)<br />
See Sanson, et al. (2010) The development and validation of Australian <strong>in</strong>dices of child<br />
development – Parts I and II Child Indica<strong>to</strong>rs Research, Vol 3, 275-292 and 293-312
Analytic approach<br />
• Dependent variables : Physical, Social-Emotional and<br />
Learn<strong>in</strong>g Outcome Indices at Wave 3 (age 8-9 yrs).<br />
• 3 hierarchical multiple regression analyses– 5 steps:<br />
1. Community (macro-level)<br />
2. Education and childcare (exo/meso level)<br />
3. Family structure and demographics (meso/micro-level)<br />
4. Family function<strong>in</strong>g (micro-level)<br />
5. Child characteristics<br />
• Predic<strong>to</strong>rs measured at Wave 1 (4-5 yrs) and 2 (6-7 yrs)<br />
• Each predic<strong>to</strong>r standardised (X=0, SD=1)<br />
• Used SAS surveyreg procedure <strong>to</strong> account for study design.<br />
• Weighted <strong>to</strong> adjust for non-response.
W1 and W2 predic<strong>to</strong>rs at community (macro) level;<br />
& childcare and school (exo/meso) level)<br />
Community<br />
• Community advantage/<br />
disadvantage (SEIFA <strong>in</strong>dex)<br />
• Australian Remoteness<br />
Indica<strong>to</strong>r for Areas, at postcode<br />
level (ARIA <strong>in</strong>dex)<br />
• Neighbourhood belong<strong>in</strong>g: civic<br />
engagement and positive<br />
feel<strong>in</strong>gs about neighbours (4<br />
items)<br />
Childcare & school<br />
• Age started childcare<br />
• Child's year level at school<br />
• Additional formal care (besides<br />
preschool/school)<br />
• Informal care - o<strong>the</strong>r types of<br />
care (e.g. grandparents)<br />
• Teacher communication scale:<br />
teacher communicates with<br />
parent about child’s education<br />
(6 items)
W1 and W2 family demographic<br />
and structure predic<strong>to</strong>rs<br />
• Equivalised family <strong>in</strong>come<br />
• Highest educational atta<strong>in</strong>ment of<br />
ei<strong>the</strong>r parent<br />
• Maternal age<br />
• Hous<strong>in</strong>g costs per week<br />
• Highest occupational prestige of<br />
ei<strong>the</strong>r parent<br />
• Paternal presence/absence and<br />
work status<br />
• Maternal work status<br />
• Length of time <strong>in</strong> current<br />
home<br />
• Number of homes s<strong>in</strong>ce birth<br />
• Non-Australian born parent<br />
• Two parent family<br />
• Number of sibl<strong>in</strong>gs <strong>in</strong> <strong>the</strong> home
W1 and W2 family process<br />
predic<strong>to</strong>rs<br />
• Hostile parent<strong>in</strong>g (shout<strong>in</strong>g, anger)<br />
• Warm parent<strong>in</strong>g (enjoy, show affection)<br />
• Consistent parent<strong>in</strong>g (follow<strong>in</strong>g through)<br />
• Inductive reason<strong>in</strong>g (expla<strong>in</strong>, talk it over)<br />
• Argumentative relationship between parents<br />
• Contact with grandparents<br />
• Home activities <strong>in</strong>dex: Frequency of engag<strong>in</strong>g <strong>in</strong><br />
activities with child (draw<strong>in</strong>g, s<strong>in</strong>g<strong>in</strong>g)<br />
• Out of home activities: e.g. visit<strong>in</strong>g libraries, attend<strong>in</strong>g<br />
sport<strong>in</strong>g events<br />
• Mo<strong>the</strong>r’s psychological distress<br />
• Mo<strong>the</strong>r’s alcohol consumption
W1 and W2 Child–level predic<strong>to</strong>rs<br />
• Healthy diet: Frequency of consum<strong>in</strong>g healthy (e.g., fresh<br />
fruit) and unhealthy (e.g., cordial) foods<br />
• Temperament<br />
– Approach/sociability<br />
– Persistence<br />
– Reactivity<br />
• Gender<br />
• Birth weight<br />
• Gestational age<br />
• Child speaks a language o<strong>the</strong>r than English at home<br />
• Child is of Aborig<strong>in</strong>al or Torres Strait Islander descent
Amount of variance (%) accounted by each<br />
level of predic<strong>to</strong>rs (i.e., each step)<br />
Step<br />
Doma<strong>in</strong><br />
Physical Soc/Emot Learn<strong>in</strong>g<br />
W1 W2 W1 W2 W1 W2<br />
1 Community (Macro) 3 2 5 3 4 3<br />
2 Childcare & school<br />
(Exo/meso)<br />
4<br />
(+1)<br />
3<br />
(+1)<br />
6<br />
(+1)<br />
4<br />
(+1)<br />
5<br />
(+1)<br />
4<br />
(+1)<br />
3 Family structure/<br />
demographics<br />
6<br />
(+2)<br />
6<br />
(+3)<br />
11<br />
(+5)<br />
9<br />
(+5)<br />
13<br />
(+8)<br />
13<br />
(+9)<br />
4 Family process<br />
(Micro)<br />
10<br />
(+4)<br />
10<br />
(+4)<br />
24<br />
(+13)<br />
26<br />
(+17)<br />
15<br />
(+2)<br />
14<br />
(+1)<br />
5 Child 12<br />
(+2)<br />
13<br />
(+3)<br />
30<br />
(+6)<br />
38<br />
(+12)<br />
20<br />
(+5)<br />
22<br />
(+8)
W1 and W2 Macro-level predic<strong>to</strong>rs of 3 doma<strong>in</strong>s<br />
<strong>in</strong> Wave 3 – beta coefficients<br />
Doma<strong>in</strong> Physical Soc/Emot Learn<strong>in</strong>g<br />
Step 1 W1 W2 W1 W2 W1 W2<br />
SEIFA .05* .06** .10*** .06* .19*** .16***<br />
N’hood<br />
belong<br />
.15*** .13*** .20*** .16*** .04* -<br />
- - - - -<br />
F<strong>in</strong>al step<br />
SEIFA - - .06* - .07** -<br />
N’hood<br />
belong<br />
.08*** .07*** .07*** .07*** .- -<br />
Remoteness<br />
Remoteness<br />
- - - - - -
W1 and W2 Childcare and School predic<strong>to</strong>rs of<br />
3 doma<strong>in</strong>s <strong>in</strong> Wave 3 – beta coefficients<br />
Step<br />
Doma<strong>in</strong><br />
Physical Soc/Emot Learn<strong>in</strong>g<br />
Step 2 W1 W2 W1 W2 W1 W2<br />
Age start<br />
childcare<br />
-.05** - - - -.07*** -.04*<br />
Sch year level -.07** - - - - .08***<br />
Add’l formal care -.07* - -.07** - -.07*** -<br />
Teacher<br />
communication<br />
F<strong>in</strong>al step<br />
- -.05* - .11*** - -<br />
Age start CC - - - - - -<br />
Sch year level -.06* - - - - .08***<br />
Add’l formal care -.06** - -.05** - -.06** -<br />
Teacher<br />
communication<br />
- - - -.04* - -
W1 and W2 Family structure and demographics<br />
predic<strong>to</strong>rs of 3 doma<strong>in</strong>s <strong>in</strong> Wave 3 – beta coeffts<br />
Doma<strong>in</strong> Physical Soc/Emot Learn<strong>in</strong>g<br />
Step 3 W1 W2 W1 W2 W1 W2<br />
Income from govt -.10** F -.18*** F<br />
Hous<strong>in</strong>g costs -.10*** F -.12*** F -.05*<br />
P education .06* F -- .08*** F - .21*** F .20*** F<br />
P occupation - .06* - .05* .06* .13*** F<br />
Fa<strong>the</strong>r not present - - -.39** F - - -.06**<br />
Fa<strong>the</strong>r present/not work<br />
-.06** F<br />
Mo<strong>the</strong>r not work<strong>in</strong>g .04*<br />
Mo<strong>the</strong>r work<strong>in</strong>g P/T .07*<br />
Mo<strong>the</strong>r work<strong>in</strong>g F/T<br />
-.08** F<br />
2 parents -.33** F -.16*<br />
No. of sibl<strong>in</strong>gs 07** F .11*** F .05* F .07** F -.06** F -<br />
Mo<strong>the</strong>r age - - - - . -.04* F<br />
Time <strong>in</strong> home - - - - -.04* -<br />
# house moves - - .06* - - -<br />
F = significant <strong>in</strong> f<strong>in</strong>al model
F = significant <strong>in</strong> f<strong>in</strong>al model<br />
W1 and W2 Family process predic<strong>to</strong>rs of 3<br />
doma<strong>in</strong>s <strong>in</strong> Wave 3 – beta coefficients<br />
Doma<strong>in</strong> Physical Soc/Emot Learn<strong>in</strong>g<br />
Step 4 W1 W2 W1 W2 W1 W2<br />
Hostile parent<strong>in</strong>g - -.06* -.21*** F -.27*** F -.07*** -<br />
Warm parent<strong>in</strong>g - - - .04* -.07*** F - .05** F<br />
Consistent par’g .05* .07** .10*** F .12***F .06** .06*<br />
Inductive parent<strong>in</strong>g - - - -.07 F - -<br />
Grandparent - - - - - --.06*** F<br />
Parents argu<strong>in</strong>g -.05* F - -.09*** F -.04* - -<br />
Home activities --.04* F - F -- - F - -.05* F<br />
Out-of-home<br />
activities<br />
- - .05** F .06** F .06** F .06** F<br />
Mo<strong>the</strong>r’s depress’n .14*** F .14*** F .15*** F .15*** F - -<br />
Mo<strong>the</strong>r alcohol use .06*** F .06*** F - - - -
W1 and W2 Child predic<strong>to</strong>rs of 3 doma<strong>in</strong>s <strong>in</strong><br />
Wave 3 – beta coefficients<br />
Step<br />
Doma<strong>in</strong><br />
Physical Soc/Emot Learn<strong>in</strong>g<br />
Step 5 W1 W2 W1 W2 W1 W2<br />
Diet - .05* - - - -<br />
Gender (m) - - .13*** .14*** - -<br />
Sociable .04* - - .04* - -<br />
Persistent .11*** .14*** .12*** .21*** .22*** .26***<br />
Reactive - -.10*** -.15*** -.22*** - -.05**<br />
Gestation age - .08** - - - .05*
SO : Common drivers? – Yes and No<br />
Yes: Variables contribut<strong>in</strong>g <strong>to</strong> at least 2 outcomes<br />
Macro-level (community)<br />
• Community (dis)advantage (largely mediated by later steps) (S/E, L)<br />
• Neighbourhood belong<strong>in</strong>g (partially mediated by steps 4 and 5) (S/E, P)<br />
Exo/meso-level (childcare and school)<br />
• Additional formal child care (all)<br />
Meso/micro- level (family structure and demographics)<br />
• Parental education (all, partially mediated by steps 4 and 5)<br />
• Income (govt benefits, unemployed resident fa<strong>the</strong>rs, high mortgage costs)<br />
Micro-level (family process)<br />
• Argumentative <strong>in</strong>ter-parent relationship (S/E, P)<br />
• Maternal mental health (S/E, P)<br />
• Out-of-home activities (S/E, L)<br />
Child level<br />
• Temperament: persistence (all)<br />
• Temperament: reactivity (all)<br />
• Gestational age (P, L)
SO : Common drivers? – Yes and No<br />
No: Specific drivers of specific outcomes<br />
Exo-level (childcare and school)<br />
• Teacher-parent communication (6-7 years) – Social-Emotional<br />
• Grade level (6-7 years) - -ve for Physical, +ve for Learn<strong>in</strong>g<br />
Meso/micro- level (family structure and demographics)<br />
• Mo<strong>the</strong>r work<strong>in</strong>g F/T– Social-Emotional (-ve)<br />
• Measures of parental <strong>in</strong>come - Physical<br />
• Parental occupation – Learn<strong>in</strong>g<br />
• Parental education – much stronger for Learn<strong>in</strong>g<br />
• Maternal age - Learn<strong>in</strong>g<br />
• Number of sibl<strong>in</strong>gs – positive for Physical, negative for Learn<strong>in</strong>g<br />
Micro-level (family process)<br />
• Hostile parent<strong>in</strong>g – Social-Emotional (strong effect)<br />
• Consistent parent<strong>in</strong>g – Social-Emotional<br />
• Warm parent<strong>in</strong>g – Learn<strong>in</strong>g (-ve)<br />
• Contact with grandparents - Learn<strong>in</strong>g (-ve)<br />
• Maternal depression – strongest for Physical and Social-Emotional<br />
• With<strong>in</strong>-home activities - +ve for Social-Emot, -ve for Phys and Learn<strong>in</strong>g<br />
Child level<br />
• Diet – Physical<br />
• Male – Social-Emotional
Prediction from Wave 1 versus Wave 2<br />
Whe<strong>the</strong>r ‘exposure’ was at 4 years or 6 years generally made<br />
little difference:<br />
• Similar amount of variance expla<strong>in</strong>ed by steps 1-4 at each age<br />
• Step 5: prediction of Social-Emotional is stronger from W2 (12%)<br />
than from W1 (6%)<br />
For some variables, early exposure appeared <strong>to</strong> matter most:<br />
• Additional formal childcare<br />
• Hous<strong>in</strong>g costs for Social-Emotional and Physical<br />
For some variables, later exposure appeared <strong>to</strong> matter most:<br />
• Teacher communication for Social-Emotional<br />
• Grandparent contact for Learn<strong>in</strong>g (-ve)
Limitations and areas for fur<strong>the</strong>r <strong>in</strong>vestigation<br />
Prediction was modest <strong>to</strong> moderate:<br />
– only 12-13% of variance on Physical<br />
– 30-38% of variance on Social-Emotional<br />
– 20-22% of variance on Learn<strong>in</strong>g<br />
‣ Selection of predic<strong>to</strong>r variables – many o<strong>the</strong>rs could be <strong>in</strong>cluded<br />
‣ Outcome Indices are composite measures – more differentiation may be<br />
possible with more f<strong>in</strong>e-gra<strong>in</strong>ed outcomes<br />
For <strong>the</strong> future :<br />
Explicit test<strong>in</strong>g of mediational hypo<strong>the</strong>ses<br />
• e.g. is impact of poor neighbourhood and low <strong>in</strong>come mediated through<br />
parent<strong>in</strong>g and maternal depression?<br />
Test<strong>in</strong>g for non-l<strong>in</strong>ear and <strong>in</strong>teractional effects<br />
• e.g. do parental hostility and consistency <strong>in</strong>teract with child reactivity, with<br />
synergistic effects on Social-Emotional?<br />
Different predic<strong>to</strong>rs and pathways for different subgroups?<br />
• E.g. ‘comorbid’ groups; Indigenous and recent migrant groups; children<br />
with specific conditions
Implications for prevention<br />
• Set of fac<strong>to</strong>rs that should be taken <strong>in</strong><strong>to</strong> consideration <strong>in</strong> any<br />
preventive or treatment <strong>in</strong>tervention<br />
– From every level of <strong>the</strong> ecology of children’s lives<br />
– Multi-level, multi-component, multi-modal <strong>in</strong>terventions<br />
• O<strong>the</strong>rs which may be particularly salient for specific outcomes<br />
– Careful tailor<strong>in</strong>g <strong>to</strong> specific needs<br />
– But co-occurrence of problems -> not <strong>to</strong>o specific<br />
• ‘Outer’ layers are partially mediated by ‘<strong>in</strong>ner’ layers<br />
– Rigorous test<strong>in</strong>g needed <strong>to</strong> determ<strong>in</strong>e where <strong>in</strong>tervention has<br />
greater benefits relative <strong>to</strong> costs<br />
• Need <strong>to</strong> build <strong>the</strong> ‘science’ of prevention<br />
– Multi-discipl<strong>in</strong>ary, given that multiple layers need <strong>to</strong> be addressed<br />
– Multi-sec<strong>to</strong>ral collaboration, <strong>to</strong> ensure policy and practice change
Thank you!<br />
www.aifs.gov.au/grow<strong>in</strong>gup<br />
© Copyright The University of Melbourne 2008


