MIT and Cold Fusion: A Special Report - Infinite Energy Magazine
MIT and Cold Fusion: A Special Report - Infinite Energy Magazine
MIT and Cold Fusion: A Special Report - Infinite Energy Magazine

Create successful ePaper yourself
Turn your PDF publications into a flip-book with our unique Google optimized e-Paper software.
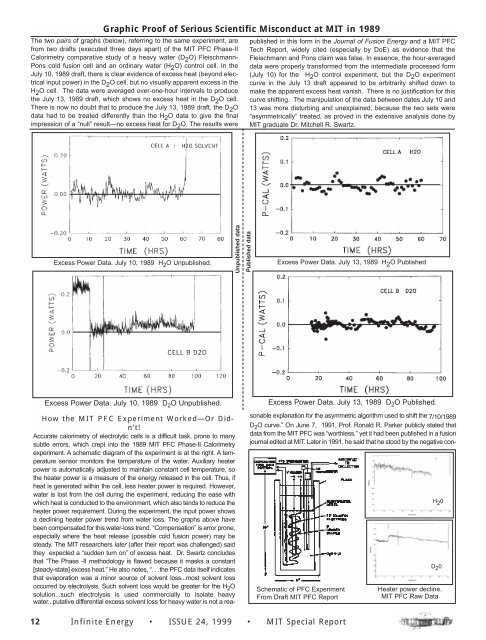
Graphic Proof of Serious Scientific Misconduct at <strong>MIT</strong> in 1989<br />
The two pairs of graphs (below), referring to the same experiment, are<br />
from two drafts (executed three days apart) of the <strong>MIT</strong> PFC Phase-II<br />
Calorimetry comparative study of a heavy water (D 2 O) Fleischmann-<br />
Pons cold fusion cell <strong>and</strong> an ordinary water (H 2 O) control cell. In the<br />
July 10, 1989 draft, there is clear evidence of excess heat (beyond electrical<br />
input power) in the D 2 O cell, but no visually apparent excess in the<br />
H 2 O cell. The data were averaged over-one-hour intervals to produce<br />
the July 13, 1989 draft, which shows no excess heat in the D 2 O cell.<br />
There is now no doubt that to produce the July 13, 1989 draft, the D 2 O<br />
data had to be treated differently than the H 2 O data to give the final<br />
impression of a “null” result—no excess heat for D 2 O. The results were<br />
published in this form in the Journal of <strong>Fusion</strong> <strong>Energy</strong> <strong>and</strong> a <strong>MIT</strong> PFC<br />
Tech <strong>Report</strong>, widely cited (especially by DoE) as evidence that the<br />
Fleischmann <strong>and</strong> Pons claim was false. In essence, the hour-averaged<br />
data were properly transformed from the intermediate processed form<br />
(July 10) for the H 2 O control experiment, but the D 2 O experiment<br />
curve in the July 13 draft appeared to be arbitrarily shifted down to<br />
make the apparent excess heat vanish. There is no justification for this<br />
curve shifting. The manipulation of the data between dates July 10 <strong>and</strong><br />
13 was more disturbing <strong>and</strong> unexplained, because the two sets were<br />
“asymmetrically” treated, as proved in the extensive analysis done by<br />
<strong>MIT</strong> graduate Dr. Mitchell R. Swartz.<br />
Excess Power Data. July 10, 1989 H 2 O Unpublished.<br />
Unpublished data<br />
Published data<br />
Excess Power Data. July 13, 1989 H 2 O Published<br />
Excess Power Data. July 10, 1989 D 2 O Unpublished.<br />
Excess Power Data. July 13, 1989 D 2 O Published.<br />
How the <strong>MIT</strong> PFC Experiment Worked—Or Didn’t!<br />
Accurate calorimetry of electrolytic cells is a difficult task, prone to many<br />
subtle errors, which crept into the 1989 <strong>MIT</strong> PFC Phase-II Calorimetry<br />
experiment. A schematic diagram of the experiment is at the right. A temperature<br />
sensor monitors the temperature of the water. Auxiliary heater<br />
power is automatically adjusted to maintain constant cell temperature, so<br />
the heater power is a measure of the energy released in the cell. Thus, if<br />
heat is generated within the cell, less heater power is required. However,<br />
water is lost from the cell during the experiment, reducing the ease with<br />
which heat is conducted to the environment, which also tends to reduce the<br />
heater power requirement. During the experiment, the input power shows<br />
a declining heater power trend from water loss. The graphs above have<br />
been compensated for this water-loss trend. “Compensation” is error prone,<br />
especially where the heat release (possible cold fusion power) may be<br />
steady. The <strong>MIT</strong> researchers later (after their report was challenged) said<br />
they expected a “sudden turn on” of excess heat. Dr. Swartz concludes<br />
that “The Phase -II methodology is flawed because it masks a constant<br />
[steady-state] excess heat.” He also notes, “. . .the PFC data itself indicates<br />
that evaporation was a minor source of solvent loss...most solvent loss<br />
occurred by electrolysis. Such solvent loss would be greater for the H 2 O<br />
solution...such electrolysis is used commercially to isolate heavy<br />
water...putative differential excess solvent loss for heavy water is not a rea-<br />
sonable explanation for the asymmetric algorithm used to shift the 7/10/1989<br />
D 2 O curve.” On June 7, 1991, Prof. Ronald R. Parker publicly stated that<br />
data from the <strong>MIT</strong> PFC was “worthless,” yet it had been published in a fusion<br />
journal edited at <strong>MIT</strong>. Later in 1991, he said that he stood by the negative con-<br />
Schematic of PFC Experiment<br />
From Draft <strong>MIT</strong> PFC <strong>Report</strong><br />
H 2 0<br />
D 2 0<br />
Heater power decline.<br />
<strong>MIT</strong> PFC Raw Data<br />
12 <strong>Infinite</strong> <strong>Energy</strong> • ISSUE 24, 1999 • <strong>MIT</strong> <strong>Special</strong> <strong>Report</strong>