River Cities Triathlon 2012 Age Group Results - Sportspectrum
River Cities Triathlon 2012 Age Group Results - Sportspectrum
River Cities Triathlon 2012 Age Group Results - Sportspectrum

Create successful ePaper yourself
Turn your PDF publications into a flip-book with our unique Google optimized e-Paper software.
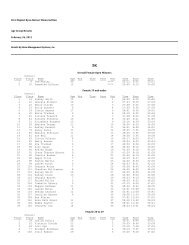
46 399 Cyril Russel 313 39 47 19:47.9 2:15/M 2:34.4 39 51:58.9 21.0MPH 1:59.1 59 30:33.3 9:51/M 1:46:53.8<br />
47 417 David Martin 251 35 50 20:10.4 2:18/M 2:58.6 53 56:10.1 19.4MPH 2:40.2 45 26:01.7 8:24/M 1:48:01.3<br />
48 439 Bryan Patchen 324 39 9 14:49.9 1:41/M 2:28.9 62 59:27.2 18.4MPH 2:40.7 55 29:43.4 9:35/M 1:49:10.3<br />
49 467 Judson Moore 273 37 46 19:40.2 2:14/M 3:48.9 36 51:38.9 21.1MPH 2:50.8 61 32:29.6 10:29/M 1:50:28.5<br />
50 472 Philip Medford 304 38 56 21:17.7 2:25/M 4:03.6 38 51:56.7 21.0MPH 3:36.9 56 29:46.0 9:36/M 1:50:41.0<br />
51 489 Daniel Giacomazza 325 39 61 22:09.4 2:31/M 2:35.1 50 55:41.1 19.6MPH 2:20.5 54 29:04.9 9:23/M 1:51:51.3<br />
52 491 Shane Hogan 321 39 45 19:39.7 2:14/M 3:18.7 54 56:19.2 19.4MPH 2:12.2 58 30:32.2 9:51/M 1:52:02.0<br />
53 495 Jeffrey Gosslee 269 36 58 21:27.7 2:26/M 3:20.1 61 59:16.9 18.4MPH 2:28.5 44 25:51.1 8:20/M 1:52:24.5<br />
54 533 David Judice 300 38 48 19:49.2 2:15/M 2:08.9 52 55:57.7 19.5MPH 2:28.5 66 33:59.7 10:58/M 1:54:24.1<br />
55 535 Brandon Clark 329 39 55 21:10.4 2:24/M 4:05.1 59 58:23.2 18.7MPH 2:26.8 52 28:23.3 9:09/M 1:54:29.1<br />
56 550 Corey Wichelns 291 38 41 19:10.2 2:11/M 2:18.4 60 58:55.4 18.5MPH 2:05.0 62 32:43.9 10:33/M 1:55:13.1<br />
57 560 Jim Cotter 255 35 26 17:09.7 1:57/M 3:10.9 64 1:00:15.7 18.1MPH 2:16.7 65 33:15.2 10:44/M 1:56:08.3<br />
58 562 David Tucker 281 37 70 25:45.9 2:56/M 2:54.6 46 53:44.4 20.3MPH 2:11.5 60 31:36.7 10:12/M 1:56:13.3<br />
59 574 Michael Montgomery 307 38 72 34:38.4 3:56/M 2:09.6 48 54:50.7 19.9MPH 2:05.3 22 23:35.6 7:36/M 1:57:19.8<br />
60 599 Gene William 310 38 66 23:55.7 2:43/M 3:53.1 63 59:56.2 18.2MPH 2:25.2 53 28:23.4 9:09/M 1:58:33.8<br />
61 656 Ross Hansen 267 36 53 20:46.7 2:22/M 4:50.6 70 1:13:03.9 14.9MPH 1:46.3 12 21:54.8 7:04/M 2:02:22.5<br />
62 672 Patrick Hammond 320 39 60 21:58.5 2:30/M 3:59.6 65 1:01:25.6 17.8MPH 3:06.8 63 32:53.1 10:36/M 2:03:23.8<br />
63 706 Brian Bouillon 781 35 68 24:57.7 2:50/M 5:33.9 58 57:53.2 18.9MPH 3:12.9 67 35:09.2 11:20/M 2:06:47.1<br />
64 708 Brian Thomas 254 35 67 24:48.7 2:49/M 3:34.9 67 1:05:03.9 16.8MPH 3:04.1 57 30:24.5 9:48/M 2:06:56.3<br />
65 710 Matthew Miles 327 39 69 25:14.4 2:52/M 3:10.1 66 1:03:49.2 17.1MPH 1:40.9 64 33:09.5 10:42/M 2:07:04.3<br />
66 737 Owen Johnson 306 38 71 28:52.9 3:17/M 4:46.1 57 57:39.4 18.9MPH 2:10.1 69 37:40.5 12:09/M 2:11:09.3<br />
67 774 David Scott 334 39 63 22:25.9 2:33/M 5:34.6 69 1:09:40.4 15.7MPH 4:43.4 68 36:49.5 11:53/M 2:19:14.0<br />
68 797 Richard Chavers 271 36 57 21:18.9 2:25/M 4:56.9 72 1:18:01.2 14.0MPH 4:17.7 70 38:13.5 12:20/M 2:26:48.3<br />
69 798 Chuck Wooden 292 38 62 22:09.7 2:31/M 5:34.9 68 1:05:38.2 16.6MPH 5:38.5 71 47:51.9 15:26/M 2:26:53.3<br />
Top<br />
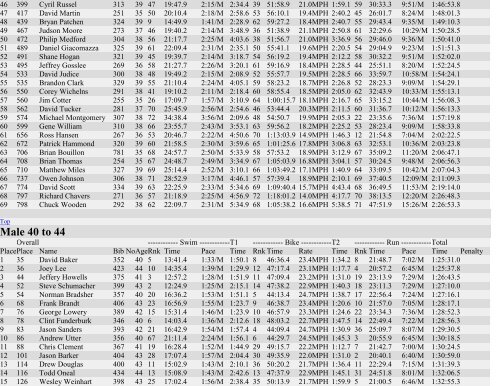
Male 40 to 44<br />
Overall ------------ Swim ------------ T1 ------------ Bike ------------ T2 ------------ Run ------------ Total<br />
Place Place Name Bib No <strong>Age</strong> Rnk Time Pace Time Rnk Time Rate Time Rnk Time Pace Time Penalty<br />
1 35 David Baker 352 40 5 13:41.4 1:33/M 1:50.1 8 46:36.4 23.4MPH 1:34.2 8 21:48.7 7:02/M 1:25:31.0<br />
2 36 Joey Lee 423 44 10 14:35.4 1:39/M 1:29.9 12 47:17.4 23.1MPH 1:17.7 4 20:57.2 6:45/M 1:25:37.8<br />
3 44 Jeffery Howells 375 41 3 12:57.2 1:28/M 1:51.9 11 47:09.4 23.2MPH 1:31.0 19 23:13.9 7:29/M 1:26:43.5<br />
4 52 Steve Schumacher 399 43 2 12:24.9 1:25/M 2:15.1 14 47:38.2 22.9MPH 1:40.3 18 23:11.3 7:29/M 1:27:10.0<br />
5 54 Norman Bradsher 357 40 20 16:36.2 1:53/M 1:51.1 5 44:13.4 24.7MPH 1:38.7 17 22:56.4 7:24/M 1:27:16.1<br />
6 68 Frank Brandt 406 43 23 16:56.9 1:55/M 1:23.7 9 46:38.7 23.4MPH 1:20.6 10 21:57.0 7:05/M 1:28:17.1<br />
7 76 George Lowery 389 42 15 15:31.4 1:46/M 1:23.9 10 46:57.9 23.3MPH 1:24.6 22 23:34.3 7:36/M 1:28:52.3<br />
8 78 Clint Funderburk 346 40 6 14:03.4 1:36/M 2:12.6 18 48:03.2 22.7MPH 1:47.5 14 22:49.4 7:22/M 1:28:56.3<br />
9 83 Jason Sanders 393 42 21 16:42.9 1:54/M 1:57.4 4 44:09.4 24.7MPH 1:30.9 36 25:09.7 8:07/M 1:29:30.5<br />
10 86 Andrew Utter 356 40 67 21:11.4 2:24/M 1:56.1 6 44:29.7 24.5MPH 1:45.3 3 20:55.9 6:45/M 1:30:18.5<br />
11 88 Chris Clement 367 41 19 16:28.4 1:52/M 1:44.9 29 49:15.7 22.2MPH 1:12.7 7 21:42.7 7:00/M 1:30:24.5<br />
12 101 Jason Barker 404 43 28 17:07.4 1:57/M 2:04.4 30 49:35.9 22.0MPH 1:31.0 2 20:40.1 6:40/M 1:30:59.0<br />
13 114 Drew Douglas 400 43 11 15:02.9 1:43/M 2:10.1 36 50:20.2 21.7MPH 1:36.4 11 22:29.4 7:15/M 1:31:39.3<br />
14 116 Todd Oneal 434 44 13 15:08.9 1:43/M 2:42.6 13 47:37.9 22.9MPH 1:45.1 31 24:51.8 8:01/M 1:32:06.5<br />
15 126 Wesley Weinhart 398 43 25 17:02.4 1:56/M 2:38.4 35 50:13.9 21.7MPH 1:59.9 5 21:00.5 6:46/M 1:32:55.3