

Ensuring quality of life in Europe's cities and towns - New Bridges
Ensuring quality of life in Europe's cities and towns - New Bridges
Ensuring quality of life in Europe's cities and towns - New Bridges

Create successful ePaper yourself
Turn your PDF publications into a flip-book with our unique Google optimized e-Paper software.
Quality <strong>of</strong> <strong>life</strong> <strong>and</strong> drivers <strong>of</strong> change<br />
over Europe aga<strong>in</strong> demonstrate local variations<br />
with<strong>in</strong> this overall pattern. Accord<strong>in</strong>g to the State<br />
<strong>of</strong> European <strong>cities</strong> report (EC, 2007b), a third <strong>of</strong> <strong>cities</strong><br />
grew between 1996 <strong>and</strong> 2001, a third witnessed<br />
stable populations, <strong>and</strong> a third experienced a<br />
notable decl<strong>in</strong>e <strong>in</strong> population (Map 2.1). In general,<br />
large <strong>cities</strong> have been exp<strong>and</strong><strong>in</strong>g more quickly<br />
than smaller ones. Growth has been greatest <strong>in</strong><br />
peripheral urban areas, while core <strong>cities</strong> with<strong>in</strong><br />
these urban agglomerations have experienced a<br />
decrease <strong>in</strong> population.<br />
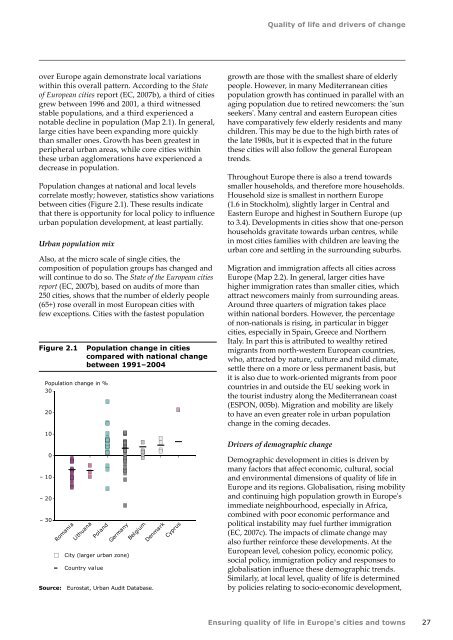
Population changes at national <strong>and</strong> local levels<br />
correlate mostly; however, statistics show variations<br />
between <strong>cities</strong> (Figure 2.1). These results <strong>in</strong>dicate<br />
that there is opportunity for local policy to <strong>in</strong>fluence<br />
urban population development, at least partially.<br />
Urban population mix<br />
Also, at the micro scale <strong>of</strong> s<strong>in</strong>gle <strong>cities</strong>, the<br />
composition <strong>of</strong> population groups has changed <strong>and</strong><br />
will cont<strong>in</strong>ue to do so. The State <strong>of</strong> the European <strong>cities</strong><br />
report (EC, 2007b), based on audits <strong>of</strong> more than<br />
250 <strong>cities</strong>, shows that the number <strong>of</strong> elderly people<br />
(65+) rose overall <strong>in</strong> most European <strong>cities</strong> with<br />
few exceptions. Cities with the fastest population<br />
Figure 2.1<br />
Population change <strong>in</strong> %<br />
30<br />
20<br />
10<br />
0<br />
– 10<br />
– 20<br />
– 30<br />
Romania<br />
Lithuana<br />
Population change <strong>in</strong> <strong>cities</strong><br />
compared with national change<br />
between 1991–2004<br />
Pol<strong>and</strong><br />
Germany<br />
City (larger urban zone)<br />
Country value<br />
Belgium<br />
Source: Eurostat, Urban Audit Database.<br />
Denmark<br />
Cyprus<br />
growth are those with the smallest share <strong>of</strong> elderly<br />
people. However, <strong>in</strong> many Mediterranean <strong>cities</strong><br />
population growth has cont<strong>in</strong>ued <strong>in</strong> parallel with an<br />
ag<strong>in</strong>g population due to retired newcomers: the 'sun<br />
seekers'. Many central <strong>and</strong> eastern European <strong>cities</strong><br />
have comparatively few elderly residents <strong>and</strong> many<br />
children. This may be due to the high birth rates <strong>of</strong><br />
the late 1980s, but it is expected that <strong>in</strong> the future<br />
these <strong>cities</strong> will also follow the general European<br />
trends.<br />
Throughout Europe there is also a trend towards<br />
smaller households, <strong>and</strong> therefore more households.<br />
Household size is smallest <strong>in</strong> northern Europe<br />
(1.6 <strong>in</strong> Stockholm), slightly larger <strong>in</strong> Central <strong>and</strong><br />
Eastern Europe <strong>and</strong> highest <strong>in</strong> Southern Europe (up<br />
to 3.4). Developments <strong>in</strong> <strong>cities</strong> show that one‐person<br />
households gravitate towards urban centres, while<br />
<strong>in</strong> most <strong>cities</strong> families with children are leav<strong>in</strong>g the<br />
urban core <strong>and</strong> settl<strong>in</strong>g <strong>in</strong> the surround<strong>in</strong>g suburbs.<br />
Migration <strong>and</strong> immigration affects all <strong>cities</strong> across<br />
Europe (Map 2.2). In general, larger <strong>cities</strong> have<br />
higher immigration rates than smaller <strong>cities</strong>, which<br />
attract newcomers ma<strong>in</strong>ly from surround<strong>in</strong>g areas.<br />
Around three quarters <strong>of</strong> migration takes place<br />
with<strong>in</strong> national borders. However, the percentage<br />
<strong>of</strong> non‐nationals is ris<strong>in</strong>g, <strong>in</strong> particular <strong>in</strong> bigger<br />
<strong>cities</strong>, especially <strong>in</strong> Spa<strong>in</strong>, Greece <strong>and</strong> Northern<br />
Italy. In part this is attributed to wealthy retired<br />
migrants from north‐western European countries,<br />
who, attracted by nature, culture <strong>and</strong> mild climate,<br />
settle there on a more or less permanent basis, but<br />
it is also due to work‐oriented migrants from poor<br />
countries <strong>in</strong> <strong>and</strong> outside the EU seek<strong>in</strong>g work <strong>in</strong><br />
the tourist <strong>in</strong>dustry along the Mediterranean coast<br />
(ESPON, 005b). Migration <strong>and</strong> mobility are likely<br />
to have an even greater role <strong>in</strong> urban population<br />
change <strong>in</strong> the com<strong>in</strong>g decades.<br />
Drivers <strong>of</strong> demographic change<br />
Demographic development <strong>in</strong> <strong>cities</strong> is driven by<br />
many factors that affect economic, cultural, social<br />
<strong>and</strong> environmental dimensions <strong>of</strong> <strong>quality</strong> <strong>of</strong> <strong>life</strong> <strong>in</strong><br />
Europe <strong>and</strong> its regions. Globalisation, ris<strong>in</strong>g mobility<br />
<strong>and</strong> cont<strong>in</strong>u<strong>in</strong>g high population growth <strong>in</strong> <strong>Europe's</strong><br />
immediate neighbourhood, especially <strong>in</strong> Africa,<br />
comb<strong>in</strong>ed with poor economic performance <strong>and</strong><br />
political <strong>in</strong>stability may fuel further immigration<br />
(EC, 2007c). The impacts <strong>of</strong> climate change may<br />
also further re<strong>in</strong>force these developments. At the<br />
European level, cohesion policy, economic policy,<br />
social policy, immigration policy <strong>and</strong> responses to<br />
globalisation <strong>in</strong>fluence these demographic trends.<br />
Similarly, at local level, <strong>quality</strong> <strong>of</strong> <strong>life</strong> is determ<strong>in</strong>ed<br />
by policies relat<strong>in</strong>g to socio‐economic development,<br />
<strong>Ensur<strong>in</strong>g</strong> <strong>quality</strong> <strong>of</strong> <strong>life</strong> <strong>in</strong> <strong>Europe's</strong> <strong>cities</strong> <strong>and</strong> <strong>towns</strong><br />
27