Facilitating Conservation Farming Practices and Enhancing ...
Facilitating Conservation Farming Practices and Enhancing ...
Facilitating Conservation Farming Practices and Enhancing ...

Create successful ePaper yourself
Turn your PDF publications into a flip-book with our unique Google optimized e-Paper software.
16<br />
Several South American studies have indicated<br />
that crop residue left on the soil surface in no-till<br />
systems results in a reduction in surface soil water loss<br />
due to evaporation of up to 30 percent (Damalgo et al., 2004).<br />
As noted previously, the formation of healthier soil structure,<br />
macro pores, cracks <strong>and</strong> earthworm burrows through longterm<br />
no-till improves infiltration of water into the soil.<br />
Blanco-Canqui <strong>and</strong> Lal (2007) observed that removing more<br />
than 50 percent of the corn stover from the soil surface reduced initial<br />
water infiltration rates – measured for the first hour – by a<br />
factor of four in a hilly Rayne silt loam <strong>and</strong> by a factor of two on<br />
a rolling Celina silt loam soil, noting the unprotected soil was<br />
more prone to crusting <strong>and</strong> had fewer surface-connected earthworm<br />
burrows than residue-protected soils.<br />
Water that infiltrates into the soil rather than running off into ditches<br />
<strong>and</strong> streams is more likely to be available to the crop later in the season.<br />
That can be important in dry years or semi-arid areas, <strong>and</strong> will grow<br />
ever more critical as pressure mounts to manage every acre to produce<br />
its maximum potential yield.<br />
When water follows its natural pathway of infiltrating into healthy soil<br />
rather than flowing across the soil surface in gully-like rills or broad sheets,<br />
it flows to the water table <strong>and</strong> feeds rivers <strong>and</strong> streams through subsurface<br />
flow. That water is filtered by the soil through which it passes, <strong>and</strong> the<br />
rate of its introduction to the stream is moderated by hydraulic pressure in<br />
the ground. If the adoption rate of conservation tillage <strong>and</strong> other BMPs is<br />
high enough, the result can be cleaner water <strong>and</strong> potentially less dramatic<br />
flood events compared to replenishment by surface flow.<br />
An Ohio study compared the total water runoff from a 1.2 acre area<br />
with a 9-percent slope that had been continuously no-tilled with a similar<br />
test area that had been conventionally tilled. Over four years, runoff was<br />
99 percent less where long-term no-till had been practiced (Edwards et<br />
al., 1989). The authors attributed the vast difference in infiltration to the<br />
development of macro pores in the no-tilled soils.<br />
In a study of the Pecatonica River in Wisconsin, Potter (1991) documented<br />
a decrease in winter/spring flood peaks <strong>and</strong> volumes, as well<br />
as an increase in base flow from infiltration of water into the river. He<br />
attributed the reduced flooding to the adoption of conservation tillage<br />
in the area, noting that there were no major l<strong>and</strong>-use changes, new<br />
reservoirs or weather events to correlate with the observation.<br />
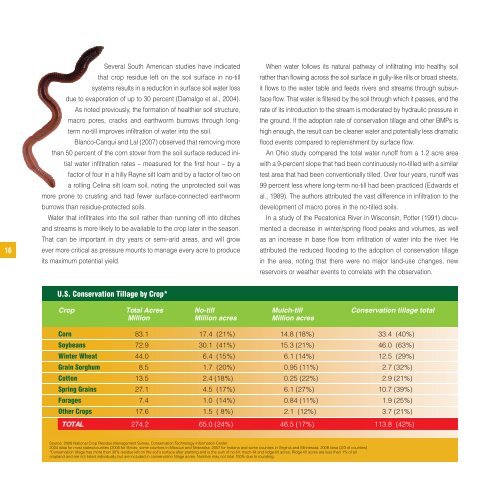
U.S. <strong>Conservation</strong> Tillage by Crop*<br />
Crop Total Acres No-till Mulch-till <strong>Conservation</strong> tillage total<br />
Million Million acres Million acres<br />
Corn 83.1 17.4 (21%) 14.8 (18%) 33.4 (40%)<br />
Soybeans 72.9 30.1 (41%) 15.3 (21%) 46.0 (63%)<br />
Winter Wheat 44.0 6.4 (15%) 6.1 (14%) 12.5 (29%)<br />
Grain Sorghum 8.5 1.7 (20%) 0.95 (11%) 2.7 (32%)<br />
Cotton 13.5 2.4 (18%) 0.25 (22%) 2.9 (21%)<br />
Spring Grains 27.1 4.5 (17%) 6.1 (27%) 10.7 (39%)<br />
Forages 7.4 1.0 (14%) 0.84 (11%) 1.9 (25%)<br />
Other Crops 17.6 1.5 ( 8%) 2.1 (12%) 3.7 (21%)<br />
TOTAL 274.2 65.0 (24%) 46.5 (17%) 113.8 (42%)<br />
Source: 2008 National Crop Residue Management Survey, <strong>Conservation</strong> Technology Information Center<br />
2004 data for most states/counties (2006 for Illinois, some counties in Missouri <strong>and</strong> Nebraska; 2007 for Indiana <strong>and</strong> some counties in Virginia <strong>and</strong> Minnesota, 2008 Iowa (2/3 of counties).<br />
*<strong>Conservation</strong> tillage has more than 30% residue left on the soil’s surface after planting <strong>and</strong> is the sum of no-till, much-till <strong>and</strong> ridge-till acres. Ridge-till acres are less than 1% of all<br />
cropl<strong>and</strong> <strong>and</strong> are not listed individually but are included in conservation tillage acres. Number may not total 100% due to rounding.