Regression Equation
Regression Equation
Regression Equation

Create successful ePaper yourself
Turn your PDF publications into a flip-book with our unique Google optimized e-Paper software.
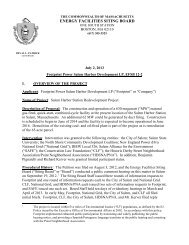
Sustainable Water Management Initiative<br />
Advisory Committee<br />
Presentation Title:<br />
Stream Categorization<br />
Date of Presentation: 21 June 2010<br />
Principle Author:<br />
Todd Richards, Massachusetts DFW<br />
The following presentation is offered for discussion purposes only and does not<br />
necessarily represent current statute, regulation, or policy positions of the<br />
Commonwealth of Massachusetts unless specifically acknowledged.<br />
This presentation is not to be cited as a reference. Its purpose is to foster open and<br />
broad discussion of the issues of sustainable water management as well as help<br />
assure public awareness of the discussions as of the date of the presentation.<br />
FOR DISCUSSION PURPOSES ONLY - NOT TO BE CITED<br />
1
Stream Categorization:<br />
Describing the Current<br />
Condition<br />
Pilot basins:<br />
SuAsCo<br />
Nashua<br />
Westfield<br />
FOR DISCUSSION PURPOSES ONLY - NOT TO BE CITED
Fish and Habitat Study<br />
Objectives<br />
1. Describe physical–basin characteristics<br />
(Basin size, elevation, slope, sand and gravel…)<br />
2. Describe human alteration factors<br />
(flow alteration, imperviousness, dams…)<br />
3. Relate fish community composition to physical basin<br />
characteristics and human alteration factors using appropriate<br />
statistical tools<br />
Physical Basin<br />
Characteristics<br />
Fish Community<br />
Characteristics<br />
Human<br />
Alteration<br />
FOR DISCUSSION PURPOSES ONLY - NOT TO BE CITED
Stream Categorization<br />
Step 1 - Not All Streams Are the Same<br />
– Group streams based on physical<br />
characteristics<br />
Step 2 - Use the Biology<br />
– Classify the current status of streams within<br />
each group based on fisheries data<br />
FOR DISCUSSION PURPOSES ONLY - NOT TO BE CITED
Fish Communities<br />
The Fish Tell the Story<br />
– Long-lived<br />
– Reflect stresses over time<br />
– Easily recognized and identified<br />
– Well-studied<br />
– Good indicators of the condition of the aquatic<br />
environment<br />
FOR DISCUSSION PURPOSES ONLY - NOT TO BE CITED
Rivers Should Have River Fish<br />
Communities<br />
What is a River Fish?<br />
Brook Trout<br />
Fallfish<br />
Creek Chubsucker Tesselated Darter Common Shiner<br />
FOR DISCUSSION PURPOSES ONLY - NOT TO BE CITED
Preliminary Assessment<br />
of Factors Influencing<br />
Riverine Fish Communities<br />
in Massachusetts<br />
by<br />
David Armstrong<br />
Sara Brandt<br />
U.S. Geological Survey<br />
Massachusetts-Rhode Island<br />
Water Science Center<br />
and<br />
Todd Richards<br />
Massachusetts DFW<br />
FOR DISCUSSION PURPOSES ONLY - NOT TO BE CITED
MDFW Fish Survey Database<br />
756 sites included in the analysis<br />
– Free Flowing Habitat (riffle/pool/run)<br />
– Wadeable Streams<br />
– 1998 to 2008<br />
Statewide distribution of sites<br />
Includes a range of values for all<br />
explanatory variables<br />
FOR DISCUSSION PURPOSES ONLY - NOT TO BE CITED
Preliminary Study<br />
Explanatory variables examined<br />
• Basin Characteristics<br />
• Drainage area<br />
• Mean elevation<br />
• Mean basin slope<br />
• Local channel slope<br />
• Percent sand and gravel<br />
• Outlet Longitude<br />
• Wetland area<br />
• Open water area<br />
FOR DISCUSSION PURPOSES ONLY - NOT TO BE CITED
Preliminary Study<br />
Explanatory variables examined<br />
• Anthropogenic factors<br />
• Flow alteration<br />
• August median flow alteration<br />
(net depletion, net surcharging)<br />
• Water-use intensity<br />
• Annual ratio of returns to unimpacted flows<br />
• Annual ratio of withdrawals to unimpacted<br />
flows<br />
• Impervious cover<br />
• Dam density<br />
FOR DISCUSSION PURPOSES ONLY - NOT TO BE CITED
Preliminary Study<br />
Response variables examined<br />
• Fish-community<br />
metrics<br />
• Fluvial Fish<br />
Relative Abundance<br />
Richness<br />
Percent<br />
• Coldwater fish<br />
• Relative Abundance<br />
• Percent<br />
• Indicator species<br />
• Brook Trout<br />
Relative Abundance<br />
Percent<br />
• White Sucker<br />
• Relative Abundance<br />
• Percent<br />
FOR DISCUSSION PURPOSES ONLY - NOT TO BE CITED
Preliminary Study Analytical methods<br />
• Quantile regression<br />
• Generalized linear modeling (GLM)<br />
FOR DISCUSSION PURPOSES ONLY - NOT TO BE CITED
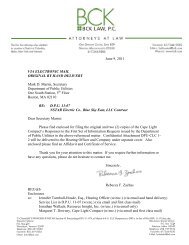
<strong>Regression</strong> <strong>Equation</strong><br />
DRAFT<br />
( Y ) = (1- π)(<br />
μ)<br />
E i<br />
γ0<br />
+ γ1z1<br />
+ γ2z2...<br />
γmzm<br />
e<br />
π = γ0<br />
+ γ1z1<br />
+ γ2z2...<br />
γmzm<br />
1+ e<br />
Probability Portion<br />
μ<br />
=<br />
e<br />
β<br />
0<br />
+ β1x1<br />
+ β2x2<br />
... β n x n<br />
Count Portion<br />
E(Y i ) = expected mean value of cpue or richness<br />
π = probability of zero from logistic processes<br />
μ= mean value from negative binomial count processes<br />
γ= coefficients of logistic equation<br />
β= coefficients of negative binomial equation<br />
z= covariates from logistic equation<br />
x= covariates from negative binomial equation<br />
FOR DISCUSSION PURPOSES ONLY - NOT TO BE CITED
Fluvial Abundance <strong>Regression</strong><br />
<strong>Equation</strong><br />
Probability portion (pi)<br />
– drainage area<br />
– longitude<br />
=<br />
The count portion (mu):<br />
– percent wetland<br />
– channel slope<br />
μ<br />
– longitude<br />
– impervious cover<br />
– percent alteration of August<br />
median streamflow<br />
γ0<br />
e<br />
1+ e<br />
+ γ<br />
+ γ<br />
... γ<br />
π γ + γ z + γ z ... γ<br />
=<br />
e<br />
FOR DISCUSSION PURPOSES ONLY - NOT TO BE CITED<br />
β<br />
0<br />
0<br />
1<br />
z<br />
1<br />
1<br />
DRAFT<br />
1<br />
2<br />
z<br />
2<br />
2<br />
2<br />
+ β1x1<br />
+ β2x2<br />
m<br />
z<br />
m<br />
m<br />
z<br />
m<br />
... β n x n
Model Validation<br />
Remove-One Model Validation<br />
Plot Observed vs Predicted<br />
Model Association in Line with Other<br />
Biological Models<br />
FOR DISCUSSION PURPOSES ONLY - NOT TO BE CITED
Plain English<br />
Keeping all other variables static,<br />
– a unit increase in impervious surface is<br />
associated with a 5.5 percent decrease in<br />
fluvial-fish relative abundance.<br />
– a unit increase in percent alteration of August<br />
median streamflow is associated with a 0.4<br />
percent decrease in fluvial-fish relative<br />
abundance<br />
FOR DISCUSSION PURPOSES ONLY - NOT TO BE CITED
Fluvial Density<br />
Fluvial Relative Abundance<br />
800<br />
DRAFT<br />
700<br />
600<br />
w estern MA<br />
central MA<br />
eastern MA<br />
500<br />
400<br />
300<br />
200<br />
100<br />
0<br />
0 20 40 60 80 100<br />
Percent net August depletion<br />
FOR DISCUSSION PURPOSES ONLY - NOT TO BE CITED
Basin-Specific Calculation<br />
Enter individual basin variables<br />
MWI 1429 Sub-basins<br />
Run <strong>Regression</strong> <strong>Equation</strong><br />
Can be Site-Specific<br />
FOR DISCUSSION PURPOSES ONLY - NOT TO BE CITED
Baseline Impervious Cover<br />
“Straw” Recommendation<br />
– Lowest subbasin IC in Major Planning Basin<br />
– Recognizing an E/W IC pattern in MA<br />
Tech Subcommittee<br />
– Use Zero IC as “True Reference”<br />
– Use Categories of IC across state<br />
Need to decide before expanding from<br />
pilot basins<br />
FOR DISCUSSION PURPOSES ONLY - NOT TO BE CITED
Example Basin 11031: Nashua<br />
<strong>Regression</strong> <strong>Equation</strong><br />
Variables:<br />
Drainage Area: 16 sqmi<br />
Wetland Area: 4.3%<br />
Channel Slope: 1%<br />
Longitude: 1.72 (sp - m)<br />
Baseline IC = 3%<br />
FOR DISCUSSION PURPOSES ONLY -<br />
NOT TO BE CITED
Fluvial Relative Abundance<br />
DRAFT<br />
Baseline Condition<br />
Fluvial Relative Abundance<br />
300<br />
250<br />
200<br />
150<br />
100<br />
50<br />
0<br />
0 20 40 60 80 100<br />
August Percent Alteration<br />
FOR DISCUSSION PURPOSES ONLY - NOT TO BE CITED
Categories<br />
Developed based on fluvial relative abundance<br />
regression equation<br />
Quantile <strong>Regression</strong><br />
– Brook Trout – Immediate, dramatic response<br />
– Species Diversity – Loss of a species by 20% August<br />
Depletion<br />
Titan – Baker and King<br />
– Sensitive species have a strong and immediate<br />
response<br />
Published tolerances for species<br />
FOR DISCUSSION PURPOSES ONLY - NOT TO BE CITED
Brook Trout Relative Abundance<br />
DRAFT<br />
August Percent Alteration<br />
FOR DISCUSSION PURPOSES ONLY - NOT TO BE CITED
Brook Trout Relative Abundance<br />
DRAFT<br />
FOR DISCUSSION PURPOSES ONLY - NOT TO BE CITED
Quantile <strong>Regression</strong><br />
Categories<br />
– Species Diversity – Loss of a species by 20% August Depletion<br />
DRAFT<br />
FOR DISCUSSION PURPOSES ONLY - NOT TO BE CITED
Categories<br />
TITAN - Baker and King<br />
– Species that Decrease with increasing flow alteration<br />
Brook trout<br />
Blacknose dace<br />
Sculpin<br />
Creek chub<br />
– Species that increase with increasing flow alteration<br />
Redfin pickerel<br />
Largemouth bass<br />
Bluegill<br />
Yellow Bullhead<br />
Native Fluvial Species<br />
Generalist Species<br />
Increasers<br />
FOR DISCUSSION PURPOSES ONLY - NOT TO BE CITED
Fish Community Response<br />
100%<br />
80%<br />
60%<br />
0-5% Biological Alteration<br />
- High quality streams<br />
- Sensitive species may<br />
be impacted<br />
40%<br />
20%<br />
0%<br />
Fish Community<br />
BCG Language: Native structural, functional, and taxonomic<br />
integrity is preserved; within range of natural variability<br />
FOR DISCUSSION PURPOSES ONLY - NOT TO BE CITED
Fish Community Response<br />
100%<br />
80%<br />
60%<br />
40%<br />
20%<br />
5-15% Biological Alteration<br />
- Sensitive species decline<br />
rapidly<br />
- Species loss increasingly<br />
likely<br />
0%<br />
Fish Community<br />
BCG Language: Some changes in fish community due to loss of some rare<br />
native species; shifts in relative abundance of species but some sensitive–<br />
species are common and abundant; ecosystem functions are fully maintained.<br />
FOR DISCUSSION PURPOSES ONLY - NOT TO BE CITED
Fish Community Response<br />
100%<br />
80%<br />
60%<br />
40%<br />
20%<br />
0%<br />
Fish Community<br />
15-30% Biological Alteration<br />
- Sensitive species loss<br />
- Decline in more tolerant<br />
fluvial species<br />
- Further reductions in<br />
diversity<br />
BCG Language: Moderate changes in structure due to replacement of<br />
some sensitive–ubiquitous species by more tolerant species, but<br />
reproducing populations of some sensitive species are maintained.<br />
FOR DISCUSSION PURPOSES ONLY - NOT TO BE CITED
Fish Community Response<br />
100%<br />
80%<br />
60%<br />
40%<br />
20%<br />
0%<br />
Fish Community<br />
30 -50% Alteration<br />
- Replacement of sensitive<br />
species with tolerant<br />
individuals<br />
- Density of tolerant<br />
individuals reduced<br />
BCG Language: Sensitive taxa are markedly diminished; conspicuously<br />
unbalanced distribution of major groups from that expected; organism<br />
condition shows signs of physiological stress; system function shows<br />
reduced complexity and redundancy.<br />
FOR DISCUSSION PURPOSES ONLY - NOT TO BE CITED
Fish Community Response<br />
100%<br />
80%<br />
60%<br />
40%<br />
20%<br />
0%<br />
Fish Community<br />
>50% Biological Alteration<br />
1. Replacement of sensitive<br />
species with tolerant<br />
individuals<br />
2. Density of tolerant<br />
individuals reduced<br />
Extreme changes in structure; wholesale changes in species composition;<br />
extreme alterations from normal abundances and distributions; organism<br />
conditioning is often poor; ecosystem functions are severely altered.<br />
FOR DISCUSSION PURPOSES ONLY - NOT TO BE CITED
Fluvial Relative Abundance<br />
Baseline Condition<br />
300<br />
250<br />
200<br />
Fluvial Relative Abundance<br />
5% Biological Loss<br />
15% Biological Loss<br />
30% Biological Loss<br />
50% Biological Loss<br />
150<br />
100<br />
50<br />
0<br />
0 20 40 60 80 100<br />
August Percent Alteration<br />
FOR DISCUSSION PURPOSES ONLY - NOT TO BE CITED
Fluvial Relative Abundance<br />
Baseline Condition<br />
300<br />
250<br />
200<br />
Fluvial Relative Abundance<br />
5% Biological Loss<br />
15% Biological Loss<br />
30% Biological Loss<br />
50% Biological Loss<br />
150<br />
100<br />
50<br />
0<br />
4% 12% 25% 45%<br />
0 20 40 60 80 100<br />
August Percent Alteration<br />
FOR DISCUSSION PURPOSES ONLY - NOT TO BE CITED
280 Sub-basins<br />
Basin IC% Aug Dep% Biol Alt % Category<br />
12039 10.2 6.79 100 5<br />
12071 6.0 1.33 45 4<br />
11031 3.8 0.05 13 2<br />
11068 3.9 0.84 15 3<br />
12076 6.1 4.34 49 4<br />
11045 3.7 100 100 5<br />
FOR DISCUSSION PURPOSES ONLY - NOT TO BE CITED
Example Basin 11031<br />
<strong>Regression</strong> <strong>Equation</strong><br />
Variables:<br />
Drainage Area: 16 sqmi<br />
Wetland Area: 4.3%<br />
Channel Slope: 1%<br />
Longitude: 1.72 (sp - m)<br />
Baseline IC = 3%<br />
FOR DISCUSSION PURPOSES ONLY -<br />
NOT TO BE CITED
Fluvial Relative Abundance<br />
Example Basin 11031<br />
Fluvial Relative Abundance<br />
300<br />
250<br />
200<br />
150<br />
100<br />
50<br />
Baseline IC = 3% (Nashua)<br />
Actual IC = 3.8%<br />
0<br />
0 10 20 30 40 50 60 70 80 90 100<br />
% August Depletion<br />
FOR DISCUSSION PURPOSES ONLY - NOT TO BE CITED
Fluvial Relative Abundance<br />
Example Basin 11031<br />
300<br />
Fluvial Relative Abundance<br />
5% Biological Loss<br />
15% Biological Loss<br />
250<br />
200<br />
150<br />
Actual August %<br />
Depletion = .05%<br />
100<br />
50<br />
0<br />
0 10 20 30 40 50 60 70 80 90 100<br />
% August Depletion<br />
FOR DISCUSSION PURPOSES ONLY - NOT TO BE CITED
Abundance<br />
Example Basin 11031<br />
5% Biological Loss<br />
Fluvial Rela<br />
300<br />
15% Biological<br />
250<br />
200<br />
Actual August %<br />
FOR DISCUSSION PURPOSES ONLY - NOT TO BE CITED
Fluvial Relative Abundance<br />
Example Basin 11031<br />
300<br />
Fluvial Relative Abundance<br />
5% Biological Loss<br />
15% Biological Loss<br />
250<br />
200<br />
150<br />
2<br />
100<br />
50<br />
0<br />
0 10 20 30 40 50 60 70 80 90 100<br />
% August Depletion<br />
Total % Biological Alteration = 13% (Category 2)<br />
Alteration Due to IC = 12%<br />
Alteration Due to August Alteration = 1%<br />
FOR DISCUSSION PURPOSES ONLY - NOT TO BE CITED
Fluvial Relative Abundance<br />
Example Basin 19056: Baseline IC 1%<br />
600<br />
500<br />
30% Biological Loss<br />
400<br />
50% Biological Loss<br />
300<br />
200<br />
4<br />
100<br />
0<br />
0 10 20 30 40 50 60 70 80 90 100<br />
% August Alteration<br />
Total % Biological Alteration = 32% (Category 4)<br />
Alteration Due to IC = 20%<br />
Alteration Due to Flow Alteration = 12%<br />
FOR DISCUSSION PURPOSES ONLY - NOT TO BE CITED
11031<br />
Nashua<br />
Reference IC = 3%<br />
FOR DISCUSSION PURPOSES ONLY - NOT TO BE CITED
Number of Sub Basins<br />
Nashua<br />
Impervious Cover Baseline<br />
50<br />
40<br />
30<br />
20<br />
3%IC and existing flow<br />
0%IC andExisting Flow<br />
10<br />
0<br />
1 2 3 4 5<br />
Category<br />
FOR DISCUSSION PURPOSES ONLY - NOT TO BE CITED
SuAsCo<br />
Reference IC = 6%<br />
FOR DISCUSSION PURPOSES ONLY - NOT TO BE CITED
Westfield<br />
Reference IC = 1%<br />
FOR DISCUSSION PURPOSES ONLY - NOT TO BE CITED
Flow Alteration<br />
FOR DISCUSSION PURPOSES ONLY - NOT TO BE CITED
Impervious Cover<br />
FOR DISCUSSION PURPOSES ONLY - NOT TO BE CITED
FOR DISCUSSION PURPOSES ONLY - NOT TO BE CITED
Decreasers<br />
Categories<br />
Titan – Baker<br />
and King<br />
– Sensitive<br />
species have<br />
a strong and<br />
immediate<br />
response<br />
= “decreasers”<br />
= “increasers”<br />
Increasers<br />
Blacknose dace<br />
Sculpin<br />
Brook Trout<br />
FOR DISCUSSION PURPOSES ONLY -<br />
NOT TO BE CITED