Low Molecular Mass Gelators of Organic Liquids - Vidyasagar ...
Low Molecular Mass Gelators of Organic Liquids - Vidyasagar ...
Low Molecular Mass Gelators of Organic Liquids - Vidyasagar ...

You also want an ePaper? Increase the reach of your titles
YUMPU automatically turns print PDFs into web optimized ePapers that Google loves.
<strong>Low</strong> molecular <strong>Mass</strong> <strong>Gelators</strong> <strong>of</strong> <strong>Organic</strong> <strong>Liquids</strong> 159<br />
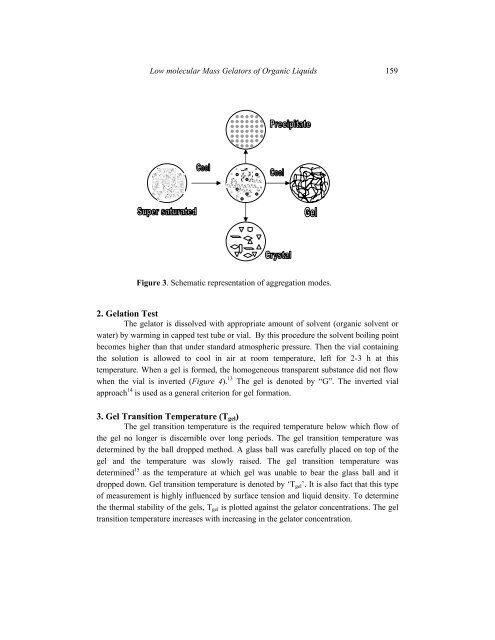
Figure 3. Schematic representation <strong>of</strong> aggregation modes.<br />
2. Gelation Test<br />
The gelator is dissolved with appropriate amount <strong>of</strong> solvent (organic solvent or<br />
water) by warming in capped test tube or vial. By this procedure the solvent boiling point<br />
becomes higher than that under standard atmospheric pressure. Then the vial containing<br />
the solution is allowed to cool in air at room temperature, left for 2-3 h at this<br />
temperature. When a gel is formed, the homogeneous transparent substance did not flow<br />
when the vial is inverted (Figure 4). 13 The gel is denoted by “G”. The inverted vial<br />
approach 14 is used as a general criterion for gel formation.<br />
3. Gel Transition Temperature (T gel )<br />
The gel transition temperature is the required temperature below which flow <strong>of</strong><br />
the gel no longer is discernible over long periods. The gel transition temperature was<br />
determined by the ball dropped method. A glass ball was carefully placed on top <strong>of</strong> the<br />
gel and the temperature was slowly raised. The gel transition temperature was<br />
determined 15 as the temperature at which gel was unable to bear the glass ball and it<br />
dropped down. Gel transition temperature is denoted by ‘T gel ’. It is also fact that this type<br />
<strong>of</strong> measurement is highly influenced by surface tension and liquid density. To determine<br />
the thermal stability <strong>of</strong> the gels, T gel is plotted against the gelator concentrations. The gel<br />
transition temperature increases with increasing in the gelator concentration.