

Pre- and post harvest factors affecting sorghum production (Sorghum bicolor L. Moench) among smallholder farming communities
A farm survey was conducted on Sorghum (Sorghum bicolor L. Moench) as a staple cereal crop adapted in arid and semi – arid lands. The objective was to determine pre - and post - harvest factors affecting sorghum production. Ninety five farmers were sampled using snowballing sampling method in six sorghum growing sub –counties (Siaya, Bondo, Njoro, Rongai, Kibwezi and Kathonzweni) to gather information on pre - and post – harvest. Data collected on source of sorghum seeds, varieties storage form and were analyzed using descriptive statistic cross tabulation SPSS version 20 software. Sources of sorghum seed were farmers own seed (33.7%), from neighbour or market (24.2%) and farm input distributors (42.1%). The results showed that 44.2% and 55.8% of the farmers preferred local and improved sorghum varieties respectively. Sorghum grains were either stored in shelled form (88.4%) or on panicles (11.6%). This study further established that farmers maintain a diversity of sorghum landraces unique in their adaptation, food quality, grain yield and quality of harvested products resistance. The results of this study can be used to explain the perennial food insecurity in these regions known to have huge potential for sorghum production. http://www.innspub.net/volume-5-number-4-october-2014-ijaar/
A farm survey was conducted on Sorghum (Sorghum bicolor L. Moench) as a staple cereal crop adapted in arid and semi – arid lands. The objective was to determine pre - and post - harvest factors affecting sorghum
production. Ninety five farmers were sampled using snowballing sampling method in six sorghum growing sub –counties (Siaya, Bondo, Njoro, Rongai, Kibwezi and Kathonzweni) to gather information on pre - and post – harvest. Data collected on source of sorghum seeds, varieties storage form and were analyzed using descriptive statistic cross tabulation SPSS version 20 software. Sources of sorghum seed were farmers own seed (33.7%),
from neighbour or market (24.2%) and farm input distributors (42.1%). The results showed that 44.2% and 55.8% of the farmers preferred local and improved sorghum varieties respectively. Sorghum grains were either
stored in shelled form (88.4%) or on panicles (11.6%). This study further established that farmers maintain a diversity of sorghum landraces unique in their adaptation, food quality, grain yield and quality of harvested
products resistance. The results of this study can be used to explain the perennial food insecurity in these regions known to have huge potential for sorghum production.
http://www.innspub.net/volume-5-number-4-october-2014-ijaar/

Create successful ePaper yourself
Turn your PDF publications into a flip-book with our unique Google optimized e-Paper software.
<strong>sorghum</strong> varieties were highest (78%) in Kibwezi sub<br />
- county (Fig. 2). Many (56.2 - 66.7%) of the<br />
respondent used their own saved seed to establish<br />
<strong>sorghum</strong> crop for the next season. The respondents<br />
who sourced <strong>sorghum</strong> seeds from either their<br />
neighbour/ market were in Kathonzweni <strong>and</strong> Rongai<br />
sub - counties (30 – 42.9%). The respondent farmers<br />
also sourced seeds from inputs distributors in<br />
Kibwezi <strong>and</strong> Njoro sub - counties (51.9 – 63.6%)<br />
(Table 1).<br />
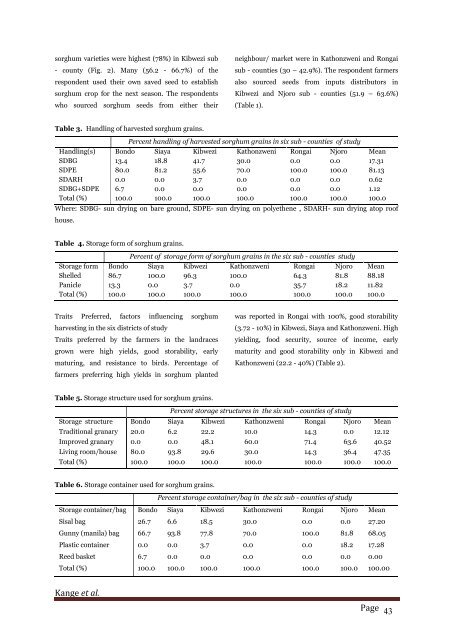
Table 3. H<strong>and</strong>ling of <strong>harvest</strong>ed <strong>sorghum</strong> grains.<br />
Percent h<strong>and</strong>ling of <strong>harvest</strong>ed <strong>sorghum</strong> grains in six sub - counties of study<br />
H<strong>and</strong>ling(s) Bondo Siaya Kibwezi Kathonzweni Rongai Njoro Mean<br />
SDBG 13.4 18.8 41.7 30.0 0.0 0.0 17.31<br />
SDPE 80.0 81.2 55.6 70.0 100.0 100.0 81.13<br />
SDARH 0.0 0.0 3.7 0.0 0.0 0.0 0.62<br />
SDBG+SDPE 6.7 0.0 0.0 0.0 0.0 0.0 1.12<br />
Total (%) 100.0 100.0 100.0 100.0 100.0 100.0 100.0<br />
Where: SDBG- sun drying on bare ground, SDPE- sun drying on polyethene , SDARH- sun drying atop roof<br />
house.<br />
Table 4. Storage form of <strong>sorghum</strong> grains.<br />
Percent of storage form of <strong>sorghum</strong> grains in the six sub - counties study<br />
Storage form Bondo Siaya Kibwezi Kathonzweni Rongai Njoro Mean<br />
Shelled 86.7 100.0 96.3 100.0 64.3 81.8 88.18<br />
Panicle 13.3 0.0 3.7 0.0 35.7 18.2 11.82<br />
Total (%) 100.0 100.0 100.0 100.0 100.0 100.0 100.0<br />
Traits <strong>Pre</strong>ferred, <strong>factors</strong> influencing <strong>sorghum</strong><br />
<strong>harvest</strong>ing in the six districts of study<br />
Traits preferred by the farmers in the l<strong>and</strong>races<br />
grown were high yields, good storability, early<br />
maturing, <strong>and</strong> resistance to birds. Percentage of<br />
farmers preferring high yields in <strong>sorghum</strong> planted<br />
was reported in Rongai with 100%, good storability<br />
(3.72 - 10%) in Kibwezi, Siaya <strong>and</strong> Kathonzweni. High<br />
yielding, food security, source of income, early<br />
maturity <strong>and</strong> good storability only in Kibwezi <strong>and</strong><br />
Kathonzweni (22.2 - 40%) (Table 2).<br />
Table 5. Storage structure used for <strong>sorghum</strong> grains.<br />
Percent storage structures in the six sub - counties of study<br />
Storage structure Bondo Siaya Kibwezi Kathonzweni Rongai Njoro Mean<br />
Traditional granary 20.0 6.2 22.2 10.0 14.3 0.0 12.12<br />
Improved granary 0.0 0.0 48.1 60.0 71.4 63.6 40.52<br />
Living room/house 80.0 93.8 29.6 30.0 14.3 36.4 47.35<br />
Total (%) 100.0 100.0 100.0 100.0 100.0 100.0 100.0<br />
Table 6. Storage container used for <strong>sorghum</strong> grains.<br />
Percent storage container/bag in the six sub - counties of study<br />
Storage container/bag Bondo Siaya Kibwezi Kathonzweni Rongai Njoro Mean<br />
Sisal bag 26.7 6.6 18.5 30.0 0.0 0.0 27.20<br />
Gunny (manila) bag 66.7 93.8 77.8 70.0 100.0 81.8 68.05<br />
Plastic container 0.0 0.0 3.7 0.0 0.0 18.2 17.28<br />
Reed basket 6.7 0.0 0.0 0.0 0.0 0.0 0.00<br />
Total (%) 100.0 100.0 100.0 100.0 100.0 100.0 100.00<br />
Kange et al.<br />
Page 43


