2012 Annual Report - Sentara.com
2012 Annual Report - Sentara.com
2012 Annual Report - Sentara.com

Create successful ePaper yourself
Turn your PDF publications into a flip-book with our unique Google optimized e-Paper software.
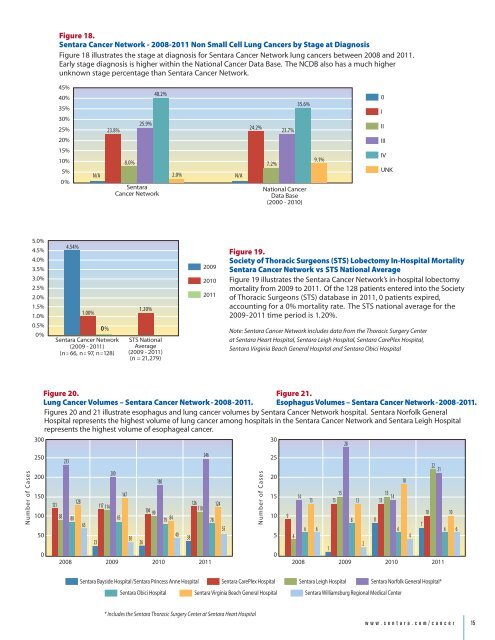
Figure 18.<br />
<strong>Sentara</strong> Cancer Network - 2008-2011 Non Small Cell Lung Cancers by Stage at Diagnosis<br />
Figure 18 illustrates the stage at diagnosis for <strong>Sentara</strong> Cancer Network lung cancers between 2008 and 2011.<br />
Early stage diagnosis is higher within the National Cancer Data Base. The NCDB also has a much higher<br />
unknown stage percentage than <strong>Sentara</strong> Cancer Network.<br />
45%<br />
40%<br />
35%<br />
30%<br />
25%<br />
20%<br />
15%<br />
10%<br />
5%<br />
0%<br />
N/A<br />
23.8%<br />
25.9%<br />
40.2%<br />
<strong>Sentara</strong><br />
Cancer Network<br />
24.2%<br />
8.0% 7.2%<br />
2.0%<br />
N/A<br />
23.7%<br />
35.6%<br />
National Cancer<br />
Data Base<br />
(2000 - 2010)<br />
9.1%<br />
0<br />
I<br />
II<br />
III<br />
IV<br />
UNK<br />
5.0%<br />
4.5%<br />
4.0%<br />
3.5%<br />
3.0%<br />
2.5%<br />
2.0%<br />
1.5%<br />
1.0%<br />
0.5%<br />
0%<br />
4.54%<br />
1.00%<br />
0 %<br />
<strong>Sentara</strong> Cancer Network<br />
(2009 - 2011)<br />
(n = 66, n = 97, n = 128)<br />
1.20%<br />
STS National<br />
Average<br />
(2009 - 2011)<br />
(n = 21, 279)<br />
2009<br />
2010<br />
2011<br />
Figure 19.<br />
Society of Thoracic Surgeons (STS) Lobectomy In-Hospital Mortality<br />
<strong>Sentara</strong> Cancer Network vs STS National Average<br />
Figure 19 illustrates the <strong>Sentara</strong> Cancer Network’s in-hospital lobectomy<br />
mortality from 2009 to 2011. Of the 128 patients entered into the Society<br />
of Thoracic Surgeons (STS) database in 2011, 0 patients expired,<br />
accounting for a 0% mortality rate. The STS national average for the<br />
2009-2011 time period is 1.20%.<br />
Note: <strong>Sentara</strong> Cancer Network includes data from the Thoracic Surgery Center<br />
at <strong>Sentara</strong> Heart Hospital, <strong>Sentara</strong> Leigh Hospital, <strong>Sentara</strong> CarePlex Hospital,<br />
<strong>Sentara</strong> Virginia Beach General Hospital and <strong>Sentara</strong> Obici Hospital<br />
Number of Cases<br />
Figure 20.<br />
Lung Cancer Volumes – <strong>Sentara</strong> Cancer Network - 2008-2011.<br />
Figure 21.<br />
Esophagus Volumes – <strong>Sentara</strong> Cancer Network - 2008-2011.<br />
Figures 20 and 21 illustrate esophagus and lung cancer volumes by <strong>Sentara</strong> Cancer Network hospital. <strong>Sentara</strong> Norfolk General<br />
Hospital represents the highest volume of lung cancer among hospitals in the <strong>Sentara</strong> Cancer Network and <strong>Sentara</strong> Leigh Hospital<br />
represents the highest volume of esophageal cancer.<br />
300 30<br />
28<br />
250 246<br />
25<br />
233<br />
200<br />
200 20<br />
180<br />
150 147<br />
15<br />
15<br />
15<br />
14<br />
14<br />
128 13<br />
121<br />
117<br />
126<br />
13<br />
13<br />
13<br />
114<br />
124<br />
104<br />
110<br />
100<br />
99<br />
10<br />
10<br />
88 80<br />
83 10 9<br />
79 84<br />
78<br />
8<br />
8<br />
65<br />
7<br />
55 6 6<br />
6<br />
6 6<br />
50 40<br />
30<br />
38<br />
5<br />
4<br />
4<br />
23<br />
26<br />
2<br />
1<br />
0 0<br />
2008 2009 2010 2011 2008<br />
2009<br />
2010<br />
2011<br />
Number of Cases<br />
18<br />
22<br />
21<br />
<strong>Sentara</strong> Bayside Hospital/<strong>Sentara</strong> Princess Anne Hospital <strong>Sentara</strong> CarePlex Hospital <strong>Sentara</strong> Leigh Hospital <strong>Sentara</strong> Norfolk General Hospital*<br />
<strong>Sentara</strong> Obici Hospital <strong>Sentara</strong> Virginia Beach General Hospital <strong>Sentara</strong> Williamsburg Regional Medical Center<br />
* Includes the <strong>Sentara</strong> Thoracic Surgery Center at <strong>Sentara</strong> Heart Hospital<br />
www.sentara.<strong>com</strong>/cancer 15