Oct-10 - Canadian Journal of Pure and Applied Sciences
Oct-10 - Canadian Journal of Pure and Applied Sciences
Oct-10 - Canadian Journal of Pure and Applied Sciences

You also want an ePaper? Increase the reach of your titles
YUMPU automatically turns print PDFs into web optimized ePapers that Google loves.
Chowdhary <strong>and</strong> Shrivastava 1279<br />
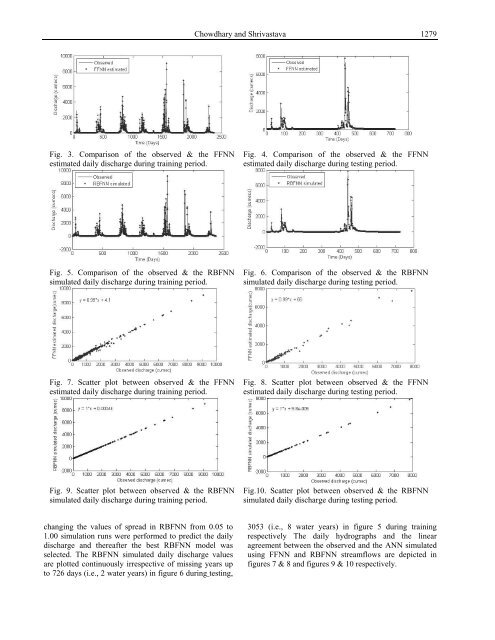
Fig. 3. Comparison <strong>of</strong> the observed & the FFNN<br />
estimated daily discharge during training period.<br />
Fig. 4. Comparison <strong>of</strong> the observed & the FFNN<br />
estimated daily discharge during testing period.<br />
Fig. 5. Comparison <strong>of</strong> the observed & the RBFNN<br />
simulated daily discharge during training period.<br />
Fig. 6. Comparison <strong>of</strong> the observed & the RBFNN<br />
simulated daily discharge during testing period.<br />
Fig. 7. Scatter plot between observed & the FFNN<br />
estimated daily discharge during training period.<br />
Fig. 8. Scatter plot between observed & the FFNN<br />
estimated daily discharge during testing period.<br />
Fig. 9. Scatter plot between observed & the RBFNN<br />
simulated daily discharge during training period.<br />
Fig.<strong>10</strong>. Scatter plot between observed & the RBFNN<br />
simulated daily discharge during testing period.<br />
changing the values <strong>of</strong> spread in RBFNN from 0.05 to<br />
1.00 simulation runs were performed to predict the daily<br />
discharge <strong>and</strong> thereafter the best RBFNN model was<br />
selected. The RBFNN simulated daily discharge values<br />
are plotted continuously irrespective <strong>of</strong> missing years up<br />
to 726 days (i.e., 2 water years) in figure 6 during testing,<br />
3053 (i.e., 8 water years) in figure 5 during training<br />
respectively The daily hydrographs <strong>and</strong> the linear<br />
agreement between the observed <strong>and</strong> the ANN simulated<br />
using FFNN <strong>and</strong> RBFNN streamflows are depicted in<br />
figures 7 & 8 <strong>and</strong> figures 9 & <strong>10</strong> respectively.