WaterWorks June 2002 - WIOA
WaterWorks June 2002 - WIOA
WaterWorks June 2002 - WIOA

Create successful ePaper yourself
Turn your PDF publications into a flip-book with our unique Google optimized e-Paper software.
L O W - A L K A L I N I T Y M E A S U R E M E N T<br />
LOW-ALKALINITY<br />
MEASUREMENT USING THE<br />
GRAN PLOT TECHNIQUE<br />
Peter Gebbie, Earth Tech<br />
Many water treatment plant Operators<br />
routinely determine the alkalinity of raw<br />
or treated water samples using a titrimetric<br />
method with a coloured indicator.<br />
In Australia, many raw and treated<br />
surface water supplies have low alkalinities,<br />
often 20 - 50 mg/L, and at these<br />
levels there is considerable room for error<br />
in analyses due to the following:<br />
• very small volumes of titrant acid are<br />
required,<br />
• large sample volumes are required, and<br />
• difficulties in detecting the titration endpoint<br />
with commonly used colour<br />
indicators, again made difficult when<br />
analysing low-alkalinity water samples.<br />
I don’t know about you, but I have real<br />
trouble picking the colour change at the<br />
end-point of alkalinity titrations, especially<br />
when using the bromcresol green/methyl<br />
red “powder pillows” or “foils” available<br />
from a well-known chemical supply<br />
company.<br />
Straight bromcresol green isn’t much<br />
better: the colour changes from light blue<br />
to a pale yellow.<br />
Bromphenol blue, provided in<br />
Alkalinity Test Kits another well-known<br />
chemical supply company seems to<br />
change colour at a pH lower than the<br />
often-suggested end-point pH of 4.6-4.9,<br />
giving a high result.<br />
Standard Methods recommends a potentiometric<br />
method for low alkalinity water<br />
samples (less than 20 mg/L) using: a pH<br />
meter, 0.02N H 2 SO 4 titrant, a 200ml<br />
sample and a 10ml microburet. (By the<br />
way, the strength of the titrant acid<br />
(hydrochloric or sulphuric) you use<br />
should not be less than 0.02N to get<br />
reproducible results).<br />
This method has recently been adopted<br />
by the US EPA as part of SOP # 560 for<br />
analysis of low-alkalinity samples. It<br />
involves titration to a known pH less than<br />
18 WATERWORKS JUNE <strong>2002</strong><br />
Figure 1<br />
4.7 and then continuing the titration to<br />
second pH, 0.3 units lower than the first.<br />
However, it is very easy to overshoot the<br />
second end-point even when using a<br />
microburet, especially for very lowalkalinity<br />
water samples (< 10 mg/L).<br />
So, how to overcome the above difficulties?<br />
Easy! Use a Gran Plot!<br />
The Gran Plot method is straightforward<br />
but does involve time initially<br />
setting up an Excel spreadsheet and<br />
plotting a graph. Here’s what you do:<br />
1. Note and record the initial pH of your<br />
sample before any acid is added.<br />
2. Titrate a 100 mL water sample with<br />
standardized 0.02N HCl or H 2 SO 4 using<br />
a 150 or 200 mL beaker and a magnetic<br />
Figure 2<br />
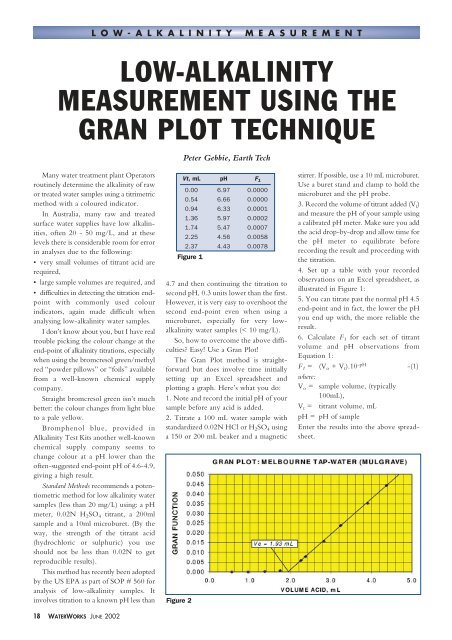
Vt, mL pH F 1<br />
0.00 6.97 0.0000<br />
0.54 6.66 0.0000<br />
0.94 6.33 0.0001<br />
1.36 5.97 0.0002<br />
1.74 5.47 0.0007<br />
2.25 4.56 0.0058<br />
2.37 4.43 0.0078<br />
stirrer. If possible, use a 10 mL microburet.<br />
Use a buret stand and clamp to hold the<br />
microburet and the pH probe.<br />
3. Record the volume of titrant added (V t )<br />
and measure the pH of your sample using<br />
a calibrated pH meter. Make sure you add<br />
the acid drop-by-drop and allow time for<br />
the pH meter to equilibrate before<br />
recording the result and proceeding with<br />
the titration.<br />
4. Set up a table with your recorded<br />
observations on an Excel spreadsheet, as<br />
illustrated in Figure 1:<br />
5. You can titrate past the normal pH 4.5<br />
end-point and in fact, the lower the pH<br />
you end up with, the more reliable the<br />
result.<br />
6. Calculate F 1 for each set of titrant<br />
volume and pH observations from<br />
Equation 1:<br />
F 1 = (V o + V t ).10 -pH -(1)<br />
where:<br />
V o = sample volume, (typically<br />
100mL),<br />
V t = titrant volume, mL<br />
pH = pH of sample<br />
Enter the results into the above spreadsheet.