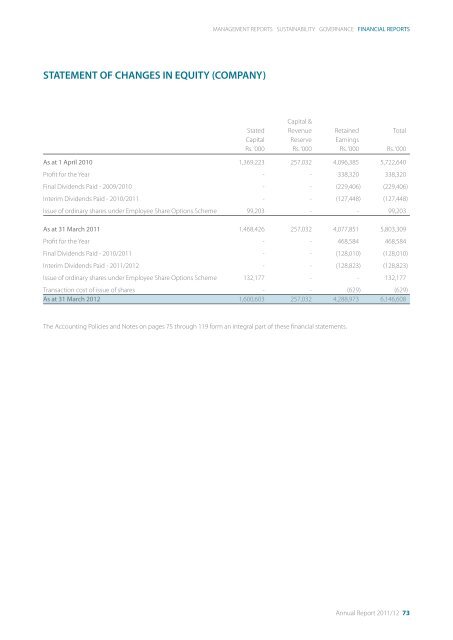
MANAGEMENT REPORTS SUSTAINABILITY GOVERNANCE FINANCIAL REPORTS STATEMENT OF CHANGES IN EQUITY (COMPANY) Capital & Stated Revenue Retained Total Capital Reserve Earnings Rs. ‘000 Rs. ‘000 Rs. ‘000 Rs. ‘000 As at 1 April 2010 1,369,223 257,032 4,096,385 5,722,640 Profit for the Year - - 338,320 338,320 Final Dividends Paid - 2009/2010 - - (229,406) (229,406) Interim Dividends Paid - 2010/2011 - - (127,448) (127,448) Issue of ordinary shares under Employee Share Options Scheme 99,203 - - 99,203 As at 31 March 2011 1,468,426 257,032 4,077,851 5,803,309 Profit for the Year - - 468,584 468,584 Final Dividends Paid - 2010/2011 - - (128,010) (128,010) Interim Dividends Paid - 2011/2012 - - (128,823) (128,823) Issue of ordinary shares under Employee Share Options Scheme 132,177 - - 132,177 Transaction cost of issue of shares - - (629) (629) As at 31 March 2012 1,600,603 257,032 4,288,973 6,146,608 The Accounting Policies and Notes on pages 75 through 119 form an integral part of these financial statements. Annual <strong>Report</strong> 2011/12 73
CASH FLOW STATEMENT Group Company Year ended 31 March 2012 2011 2012 2011 Note Rs. ‘000 Rs. ‘000 Rs. ‘000 Rs. ‘000 Operating Activities Profit Before Taxation 1,574,913 1,569,345 490,855 347,689 Adjustments for Non Cash items Depreciation 3 635,469 619,976 24,638 17,460 Profit/(Loss) on Disposal of Property, Plant and Equipment (37,651) (30,651) 2,666 (3,560) Unrealised profits 7,427 - - - Change in Fair Value of Investment Properties 4 (32,127) (24,405) (14,559) 20,445 Amortisation/Impairment of Intangible assets 6 31,399 10,119 - - Amortisation of Leasehold Property 5 3,066 3,066 - - (Profit)/Loss on Sale of Non Current Investments 1,716 (3,495) 8,175 (234) Impairment of Non Current Investments - - 10,676 - Finance Cost 28 249,718 297,737 75,085 52,136 Investment Income 25 (106) (781) (433,104) (303,383) Retirement Benefit Plan 20 32,837 65,554 12,006 3,523 Exchange (Gain)/Loss on Foreign Currency Loans 90,649 18,656 - - Working Capital Adjustments (Increase)/Decrease in Trade and Other Receivables (1,678,951) (565,446) (182,218) (26,293) (Increase)/Decrease in Inventories (324,218) (136,212) - - (Increase)/Decrease in Amounts Due from Related Parties - - 4,446 83,365 (Increase)/ Decrease in Other Long Term Receivables (145,123) (77,158) (48,605) (33,068) Increase/(Decrease) in Amounts Due to Related Parties - - (30,380) 50,870 Increase/(Decrease) in Trade and Other Payables 1,080,696 805,027 53,322 (882) Finance Cost Paid 28 (249,718) (297,737) (75,085) (52,136) Income Tax Paid (276,877) (238,714) (38,208) (17,533) Gratuity Paid 20 (14,286) (20,219) (131) (1,873) Net Cash from/(Used in) Operating Activities 948,833 1,994,663 (140,421) 136,527 Investing Activities Purchase of Property, Plant and Equipment 3 (1,580,502) (1,095,346) (43,668) (71,468) Investment in Subsidiaries - - (520,083) (121,220) Investment in Intangible Assets 6 (1,146) (941) - - Other Investments (Net) 49,528 (369,403) - - Proceeds from Disposal of Property, Plant and Equipment 93,565 178,336 8,233 11,946 Proceeds from Disposal of Investments 3,174 57,452 2,937 474 Redemption of Preference Shares (7,843) (15,687) - - Investment Income Received 25 106 781 433,104 303,383 Net Cash from/(Used in) Investing Activities (1,443,118) (1,244,808) (119,477) 123,115 Financing Activities Interest Bearing Loans and Borrowings (Net) - Rupee Loan (963,870) 259,074 437,718 (88,189) - Foreign Currency Loans 449,060 228,837 - - Proceeds from Issue of Preference Shares - 135,000 - - Proceeds from Issue of Ordinary shares under ESOS 132,177 99,203 132,177 99,203 Transaction cost of Issue of ESOS shares (4,382) - (629) - Proceeds from Minority Shareholders 277,573 15,204 - - Dividends Paid - Ordinary Shares (335,649) (393,977) (256,833) (356,853) - Preference Shares of Joint Venture Company (11,680) (4,183) - - Net Cash from/(Used in) Financing Activities (456,771) 339,158 312,433 (345,839) Net Increase/(Decrease) in Cash and Cash Equivalents (951,056) 1,089,013 52,535 (86,198) Exchange Loss (890) (1,903) - - Cash and Cash Equivalents at the beginning of the Year 23 1,769,380 682,270 (9,616) 76,582 Cash and Cash Equivalents at the end of the Year 23 817,434 1,769,380 42,919 (9,616) The Accounting Policies and Notes on pages 75 through 119 form an integral part of these financial statements. 74 The <strong>Hemas</strong> Group. Enriching Lives