Biometry and fouling study of intertidal black-lip pearl oyster, Pinctada margaritifera (Linnaeus, 1758) to determine their eligibility in the pearl culture industry
The present study on the biometry and fouling load of black-lip pearl oyster, Pinctada margaritifera (Linnaeus, 1758), was conducted to understand the eco-biology of these intertidal oysters so that their eligibility in the pearl culture industry could be determined. Biometric parameters viz., Anteroposterior measurement (APM), hinge length (HL), thickness (THK) and total weight (TWT) of each oyster were checked for their correlation with dorsoventral measurement (DVM) and fouling load (ΔF) separately by regression analysis. Shell length of collected specimens ranged between 16 ± 3.7- 88.2 ± 6.5 mm. Most of the P. margaritifera from intertidal regions of Andaman were confined to 61-80 mm size group. The average size of all the shell dimensions and TWT increased with increase in the shell length. The rate of increase of all the biometric parameters except TWT, declined in size range >41-60 mm. Maximum and minimum fouling load was observed during September 2011 (27.8 ± 5.1 g) and July 2012 (3.2 ± 3.7 g), respectively. Lower size groups showed maximum correlation indicating isometric growth but in higher size range, allometry was observed as the rate of increase of biometric parameters varied with increasing size range. On the basis of this study it could be concluded that if transferred to suspended culture at an early stage, these intertidal oysters, adapted to survive in harsh environmental conditions, would acclimatize more easily to the new environment and would cross the 61-80 mm size range becoming larger and thicker, a parameter favourable for pearl production.
The present study on the biometry and fouling load of black-lip pearl oyster, Pinctada margaritifera (Linnaeus, 1758), was conducted to understand the eco-biology of these intertidal oysters so that their eligibility in the pearl culture industry could be determined. Biometric parameters viz., Anteroposterior measurement (APM), hinge length (HL), thickness (THK) and total weight (TWT) of each oyster were checked for their correlation with dorsoventral measurement (DVM) and fouling load (ΔF) separately by regression analysis. Shell length of collected specimens ranged between 16 ± 3.7- 88.2 ± 6.5 mm. Most of the P. margaritifera from intertidal regions of Andaman were confined to 61-80 mm size group. The average size of all the shell dimensions and TWT increased with increase in the shell length. The rate of increase of all the biometric parameters except TWT, declined in size range >41-60 mm. Maximum and minimum fouling load was observed during September 2011 (27.8 ± 5.1 g) and July 2012 (3.2 ± 3.7 g), respectively. Lower size groups showed maximum correlation indicating isometric growth but in higher size range, allometry was observed as the rate of increase of biometric parameters varied with increasing size range. On the basis of this study it could be concluded that if transferred to suspended culture at an early stage, these intertidal oysters, adapted to survive in harsh environmental conditions, would acclimatize more easily to the new environment and would cross the 61-80 mm size range becoming larger and thicker, a parameter favourable for pearl production.

You also want an ePaper? Increase the reach of your titles
YUMPU automatically turns print PDFs into web optimized ePapers that Google loves.
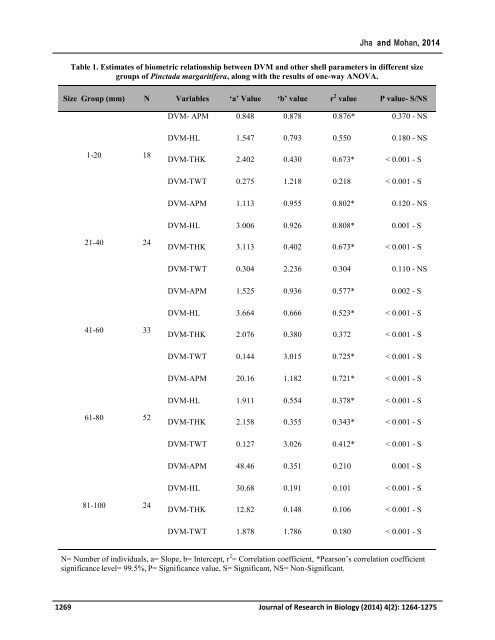
Jha <strong>and</strong> Mohan, 2014<br />
Table 1. Estimates <strong>of</strong> biometric relationship between DVM <strong>and</strong> o<strong>the</strong>r shell parameters <strong>in</strong> different size<br />
groups <strong>of</strong> <strong>P<strong>in</strong>ctada</strong> <strong>margaritifera</strong>, along with <strong>the</strong> results <strong>of</strong> one-way ANOVA.<br />
Size Group (mm) N Variables ‘a’ Value ‘b’ value r 2 value P value- S/NS<br />
DVM- APM 0.848 0.878 0.876* 0.370 - NS<br />
DVM-HL 1.547 0.793 0.550 0.180 - NS<br />
1-20 18<br />
DVM-THK 2.402 0.430 0.673* < 0.001 - S<br />
DVM-TWT 0.275 1.218 0.218 < 0.001 - S<br />
DVM-APM 1.113 0.955 0.802* 0.120 - NS<br />
DVM-HL 3.006 0.926 0.808* 0.001 - S<br />
21-40 24<br />
DVM-THK 3.113 0.402 0.673* < 0.001 - S<br />
DVM-TWT 0.304 2.236 0.304 0.110 - NS<br />
DVM-APM 1.525 0.936 0.577* 0.002 - S<br />
DVM-HL 3.664 0.666 0.523* < 0.001 - S<br />
41-60 33<br />
DVM-THK 2.076 0.380 0.372 < 0.001 - S<br />
DVM-TWT 0.144 3.015 0.725* < 0.001 - S<br />
DVM-APM 20.16 1.182 0.721* < 0.001 - S<br />
DVM-HL 1.911 0.554 0.378* < 0.001 - S<br />
61-80 52<br />
DVM-THK 2.158 0.355 0.343* < 0.001 - S<br />
DVM-TWT 0.127 3.026 0.412* < 0.001 - S<br />
DVM-APM 48.46 0.351 0.210 0.001 - S<br />
DVM-HL 30.68 0.191 0.101 < 0.001 - S<br />
81-100 24<br />
DVM-THK 12.82 0.148 0.106 < 0.001 - S<br />
DVM-TWT 1.878 1.786 0.180 < 0.001 - S<br />
N= Number <strong>of</strong> <strong>in</strong>dividuals, a= Slope, b= Intercept, r 2 = Correlation coefficient, *Pearson’s correlation coefficient<br />
significance level= 99.5%, P= Significance value, S= Significant, NS= Non-Significant.<br />
1269 Journal <strong>of</strong> Research <strong>in</strong> Biology (2014) 4(2): 1264-1275