Electrocatalytic Oxidation of Methanol: Study with Pt:Mo
Electrocatalytic Oxidation of Methanol: Study with Pt:Mo
Electrocatalytic Oxidation of Methanol: Study with Pt:Mo

You also want an ePaper? Increase the reach of your titles
YUMPU automatically turns print PDFs into web optimized ePapers that Google loves.
42 Oliveira Neto et.al J. Braz. Chem. Soc<br />
I / mA g -1 <strong>Pt</strong><br />
I / mA g -1 <strong>Pt</strong><br />
20000<br />
10000<br />
0<br />
-10000<br />
40000<br />
30000<br />
20000<br />
10000<br />
0<br />
-10000<br />
<strong>Pt</strong> : <strong>Mo</strong> (90:10)<br />
<strong>Pt</strong> : <strong>Mo</strong> (80:20)<br />
<strong>Pt</strong> : <strong>Mo</strong> (70:30)<br />
<strong>Pt</strong> : <strong>Mo</strong> (60:40)<br />
0.1 mol L -1<br />
CH 3 OH<br />
0,0 0,2 0,4 0,6 0,8 1,0<br />
<strong>Pt</strong> : <strong>Mo</strong> (90:10)<br />
<strong>Pt</strong> : <strong>Mo</strong> (80:20)<br />
<strong>Pt</strong> : <strong>Mo</strong> (70:30)<br />
<strong>Pt</strong> : <strong>Mo</strong> (60:40)<br />
E / V vs. RHE<br />
1.0 mol L -1 CH 3 OH<br />
0,0 0,2 0,4 0,6 0,8 1,0<br />
E / V vs. RHE<br />
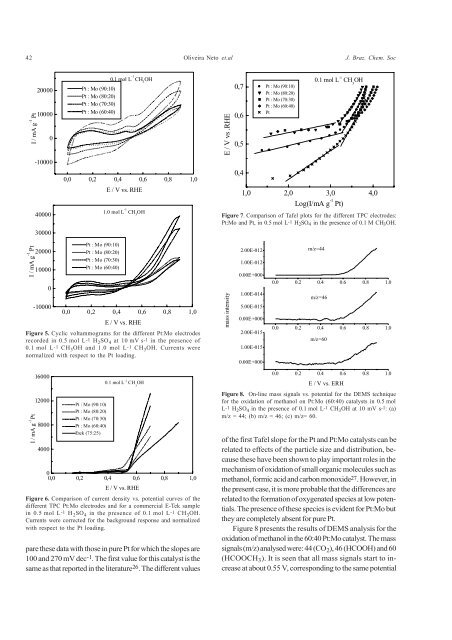
Figure 5. Cyclic voltammograms for the different <strong>Pt</strong>:<strong>Mo</strong> electrodes<br />
recorded in 0.5 mol L-1 H 2 SO 4 at 10 mV s-1 in the presence <strong>of</strong><br />
0.1 mol L-1 CH 3 OH and 1.0 mol L-1 CH 3 OH. Currents were<br />
normalized <strong>with</strong> respect to the <strong>Pt</strong> loading.<br />
I / mA g -1 <strong>Pt</strong><br />
16000<br />
12000<br />
8000<br />
4000<br />
<strong>Pt</strong> : <strong>Mo</strong> (90:10)<br />
<strong>Pt</strong> : <strong>Mo</strong> (80:20)<br />
<strong>Pt</strong> : <strong>Mo</strong> (70:30)<br />
<strong>Pt</strong> : <strong>Mo</strong> (60:40)<br />
Etek (75:25)<br />
0.1 mol L -1 CH 3 OH<br />
0<br />
0,0 0,2 0,4 0,6 0,8 1,0<br />
E / V vs. RHE<br />
Figure 6. Comparison <strong>of</strong> current density vs. potential curves <strong>of</strong> the<br />
different TPC <strong>Pt</strong>:<strong>Mo</strong> electrodes and for a commercial E-Tek sample<br />
in 0.5 mol L-1 H2SO4 in the presence <strong>of</strong> 0.1 mol L-1 CH3OH. Currents were corrected for the background response and normalized<br />
<strong>with</strong> respect to the <strong>Pt</strong> loading.<br />
pare these data <strong>with</strong> those in pure <strong>Pt</strong> for which the slopes are<br />
100 and 270 mV dec -1 . The first value for this catalyst is the<br />
same as that reported in the literature 26 . The different values<br />
E / V vs .RHE<br />
0,7<br />
0,6<br />
0,5<br />
0,4<br />
<strong>Pt</strong> : <strong>Mo</strong> (90:10)<br />
<strong>Pt</strong> : <strong>Mo</strong> (80:20)<br />
<strong>Pt</strong> : <strong>Mo</strong> (70:30)<br />
<strong>Pt</strong> : <strong>Mo</strong> (60:40)<br />
<strong>Pt</strong><br />
0.1 mol L -1 CH 3 OH<br />
1,0 2,0 3,0<br />
Log(I/mA g<br />
4,0<br />
-1 <strong>Pt</strong>)<br />
Figure 7. Comparison <strong>of</strong> Tafel plots for the different TPC electrodes:<br />
<strong>Pt</strong>:<strong>Mo</strong> and <strong>Pt</strong>, in 0.5 mol L-1 H2SO4 in the presence <strong>of</strong> 0.1 M CH3OH.<br />
mass intensity<br />
2.00E-012<br />
1.00E-012<br />
0.00E+000<br />
1.00E-014<br />
5.00E-015<br />
0.00E+000<br />
2.00E-015<br />
1.00E-015<br />
0.00E+000<br />
m/z=44<br />
0.0 0.2 0.4 0.6 0.8 1.0<br />
m/z=46<br />
0.0 0.2 0.4 0.6 0.8 1.0<br />
m/z=60<br />
0.0 0.2 0.4 0.6 0.8 1.0<br />
E / V vs. ERH<br />
Figure 8. On-line mass signals vs. potential for the DEMS technique<br />
for the oxidation <strong>of</strong> methanol on <strong>Pt</strong>:<strong>Mo</strong> (60:40) catalysts in 0.5 mol<br />
L-1 H2SO4 in the presence <strong>of</strong> 0.1 mol L-1 CH3OH at 10 mV s-1: (a)<br />
m/z = 44; (b) m/z = 46; (c) m/z= 60.<br />
<strong>of</strong> the first Tafel slope for the <strong>Pt</strong> and <strong>Pt</strong>:<strong>Mo</strong> catalysts can be<br />
related to effects <strong>of</strong> the particle size and distribution, because<br />
these have been shown to play important roles in the<br />
mechanism <strong>of</strong> oxidation <strong>of</strong> small organic molecules such as<br />
methanol, formic acid and carbon monoxide 27. However, in<br />
the present case, it is more probable that the differences are<br />
related to the formation <strong>of</strong> oxygenated species at low potentials.<br />
The presence <strong>of</strong> these species is evident for <strong>Pt</strong>:<strong>Mo</strong> but<br />
they are completely absent for pure <strong>Pt</strong>.<br />
Figure 8 presents the results <strong>of</strong> DEMS analysis for the<br />
oxidation <strong>of</strong> methanol in the 60:40 <strong>Pt</strong>:<strong>Mo</strong> catalyst. The mass<br />
signals (m/z) analysed were: 44 (CO 2), 46 (HCOOH) and 60<br />
(HCOOCH 3). It is seen that all mass signals start to increase<br />
at about 0.55 V, corresponding to the same potential