Organometallic Ni Pincer Complexes for the Electrocatalytic ...
Organometallic Ni Pincer Complexes for the Electrocatalytic ...
Organometallic Ni Pincer Complexes for the Electrocatalytic ...

You also want an ePaper? Increase the reach of your titles
YUMPU automatically turns print PDFs into web optimized ePapers that Google loves.
Inorganic Chemistry<br />
Article<br />
The protonation of 2-H with 1 equiv of HBF 4 in acetonitrile<br />
results in <strong>the</strong> clean <strong>for</strong>mation of <strong>the</strong> solvento cation [2-<br />
MeCN] + (eq 1). This was confirmed by comparison of <strong>the</strong> 1 H<br />
NMR spectrum with an au<strong>the</strong>ntic sample of [2-MeCN] +<br />
prepared through <strong>the</strong> abstraction of Cl − from 2. When 2-H<br />
was protonated in a J. Young NMR tube, H 2 was detected by<br />
1 H NMR spectroscopy. This is consistent with our proposed<br />
mechanism involving protonation of <strong>the</strong> hydride, to generate a<br />
short-lived dihydrogen complex [2-H 2 ] + in Scheme 1, followed<br />
by coordination of solvent to close <strong>the</strong> cycle. A molecular<br />
hydrogen complex is a probable intermediate in <strong>the</strong> conversion<br />
of 2-H to [2-MeCN] + but is presumably too unstable to<br />
observe spectroscopically in acetonitrile in <strong>the</strong> time scale of <strong>the</strong><br />
experiment.<br />
In <strong>the</strong> absence of protons, [2-MeCN] + shows an irreversible<br />
<strong>Ni</strong> II /<strong>Ni</strong> I wave at a potential intermediate between those of 2<br />
and 2-H (Supporting In<strong>for</strong>mation, Figure S1−3) which we<br />
believe corresponds to <strong>the</strong> [2-MeCN] + /[2-MeCN] 0 in <strong>the</strong><br />
catalytic cycle depicted in Scheme 1. The irreversibility and<br />
magnitude of <strong>the</strong> wave is caused by <strong>the</strong> inability of <strong>the</strong><br />
acetonitrile ligand to stabilize <strong>the</strong> <strong>Ni</strong> I center being <strong>for</strong>med (See<br />
Supporting In<strong>for</strong>mation <strong>for</strong> CVs at different scan rates). The<br />
reduction of <strong>the</strong> cationic [2-MeCN] + may also be coupled to a<br />
chemical process at <strong>the</strong> electrode surface. It has previously been<br />
observed that changes in ligation at <strong>the</strong> metal center alter <strong>the</strong><br />
observed electrochemical behavior. 31<br />
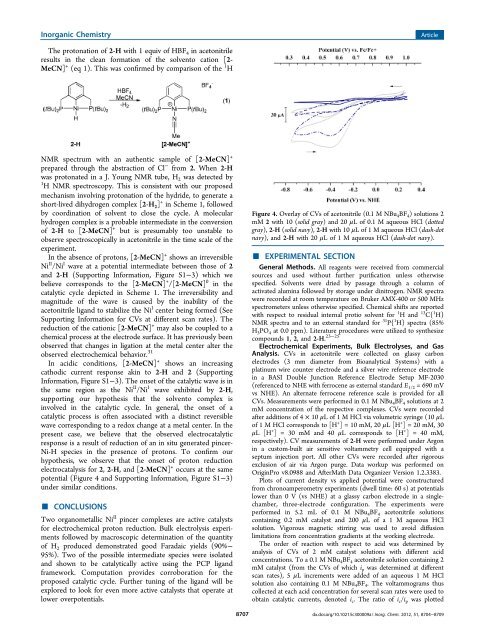
In acidic conditions, [2-MeCN] + shows an increasing<br />
cathodic current response akin to 2-H and 2 (Supporting<br />
In<strong>for</strong>mation, Figure S1−3). The onset of <strong>the</strong> catalytic wave is in<br />
<strong>the</strong> same region as <strong>the</strong> <strong>Ni</strong> II /<strong>Ni</strong> I wave exhibited by 2-H,<br />
supporting our hypo<strong>the</strong>sis that <strong>the</strong> solvento complex is<br />
involved in <strong>the</strong> catalytic cycle. In general, <strong>the</strong> onset of a<br />
catalytic process is often associated with a distinct reversible<br />
wave corresponding to a redox change at a metal center. In <strong>the</strong><br />
present case, we believe that <strong>the</strong> observed electrocatalytic<br />
response is a result of reduction of an in situ generated pincer-<br />
<strong>Ni</strong>-H species in <strong>the</strong> presence of protons. To confirm our<br />
hypo<strong>the</strong>sis, we observe that <strong>the</strong> onset of proton reduction<br />
electrocatalysis <strong>for</strong> 2, 2-H, and [2-MeCN] + occurs at <strong>the</strong> same<br />
potential (Figure 4 and Supporting In<strong>for</strong>mation, Figure S1−3)<br />
under similar conditions.<br />
■ CONCLUSIONS<br />
Two organometallic <strong>Ni</strong> II pincer complexes are active catalysts<br />
<strong>for</strong> electrochemical proton reduction. Bulk electrolysis experiments<br />
followed by macroscopic determination of <strong>the</strong> quantity<br />
of H 2 produced demonstrated good Faradaic yields (90%−<br />
95%). Two of <strong>the</strong> possible intermediate species were isolated<br />
and shown to be catalytically active using <strong>the</strong> PCP ligand<br />
framework. Computation provides corroboration <strong>for</strong> <strong>the</strong><br />
proposed catalytic cycle. Fur<strong>the</strong>r tuning of <strong>the</strong> ligand will be<br />
explored to look <strong>for</strong> even more active catalysts that operate at<br />
lower overpotentials.<br />
Figure 4. Overlay of CVs of acetonitrile (0.1 M NBu 4 BF 4 ) solutions 2<br />
mM 2 with 10 (solid gray) and 20 μL of 0.1 M aqueous HCl (dotted<br />
gray), 2-H (solid navy), 2-H with 10 μL of 1 M aqueous HCl (dash-dot<br />
navy), and 2-H with 20 μL of 1 M aqueous HCl (dash-dot navy).<br />
■ EXPERIMENTAL SECTION<br />
General Methods. All reagents were received from commercial<br />
sources and used without fur<strong>the</strong>r purification unless o<strong>the</strong>rwise<br />
specified. Solvents were dried by passage through a column of<br />
activated alumina followed by storage under dinitrogen. NMR spectra<br />
were recorded at room temperature on Bruker AMX-400 or 500 MHz<br />
spectrometers unless o<strong>the</strong>rwise specified. Chemical shifts are reported<br />
with respect to residual internal protio solvent <strong>for</strong> 1 H and 13 C{ 1 H}<br />
NMR spectra and to an external standard <strong>for</strong> 31 P{ 1 H} spectra (85%<br />
H 3 PO 4 at 0.0 ppm). Literature procedures were utilized to syn<strong>the</strong>size<br />
compounds 1, 2, and 2-H. 23−25<br />
Electrochemical Experiments, Bulk Electrolyses, and Gas<br />
Analysis. CVs in acetonitrile were collected on glassy carbon<br />
electrodes (3 mm diameter from Bioanalytical Systems) with a<br />
platinum wire counter electrode and a silver wire reference electrode<br />
in a BASI Double Junction Reference Electrode Setup MF-2030<br />
(referenced to NHE with ferrocene as external standard E 1/2 = 690 mV<br />
vs NHE). An alternate ferrocene reference scale is provided <strong>for</strong> all<br />
CVs. Measurements were per<strong>for</strong>med in 0.1 M NBu 4 BF 4 solutions at 2<br />
mM concentration of <strong>the</strong> respective complexes. CVs were recorded<br />
after additions of 4 × 10 μL of 1 M HCl via volumetric syringe (10 μL<br />
of 1 M HCl corresponds to [H + ] = 10 mM, 20 μL [H + ] = 20 mM, 30<br />
μL [H + ] = 30 mM and 40 μL corresponds to [H + ] = 40 mM,<br />
respectively). CV measurements of 2-H were per<strong>for</strong>med under Argon<br />
in a custom-built air sensitive voltammetry cell equipped with a<br />
septum injection port. All o<strong>the</strong>r CVs were recorded after rigorous<br />
exclusion of air via Argon purge. Data workup was per<strong>for</strong>med on<br />
OriginPro v8.0988 and AfterMath Data Organizer Version 1.2.3383.<br />
Plots of current density vs applied potential were constructured<br />
from chronoamperometry experiments (dwell time: 60 s) at potentials<br />
lower than 0 V (vs NHE) at a glassy carbon electrode in a singlechamber,<br />
three-electrode configuration. The experiments were<br />
per<strong>for</strong>med in 5.2 mL of 0.1 M NBu 4 BF 4 acetonitrile solutions<br />
containing 0.2 mM catalyst and 200 μL of a 1 M aqueous HCl<br />
solution. Vigorous magnetic stirring was used to avoid diffusion<br />
limitations from concentration gradients at <strong>the</strong> working electrode.<br />
The order of reaction with respect to acid was determined by<br />
analysis of CVs of 2 mM catalyst solutions with different acid<br />
concentrations. To a 0.1 M NBu 4 BF 4 acetonitrile solution containing 2<br />
mM catalyst (from <strong>the</strong> CVs of which i p was determined at different<br />
scan rates), 5 μL increments were added of an aqueous 1 M HCl<br />
solution also containing 0.1 M NBu 4 BF 4 . The voltammograms thus<br />
collected at each acid concentration <strong>for</strong> several scan rates were used to<br />
obtain catalytic currents, denoted i c . The ratio of i c /i p was plotted<br />
8707<br />
dx.doi.org/10.1021/ic300009a | Inorg. Chem. 2012, 51, 8704−8709