Discriminant Analysis - Statpower
Discriminant Analysis - Statpower
Discriminant Analysis - Statpower

Create successful ePaper yourself
Turn your PDF publications into a flip-book with our unique Google optimized e-Paper software.
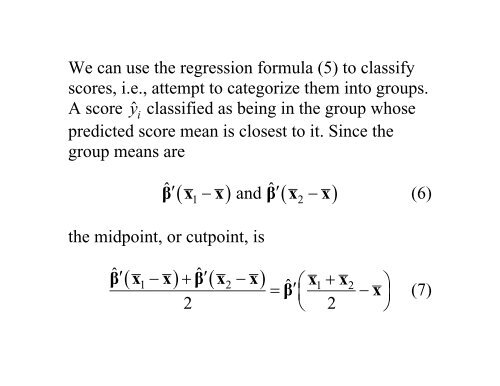
We can use the regression formula (5) to classify<br />
scores, i.e., attempt to categorize them into groups.<br />
A score y ˆi classified as being in the group whose<br />
predicted score mean is closest to it. Since the<br />
group means are<br />
βˆ′ ( x − x ) and ˆ′ ( − )<br />
the midpoint, or cutpoint, is<br />
1<br />
( ) ˆ ( )<br />
β x x (6)<br />
βˆ′ x1− x + β′<br />
x2 − x<br />
ˆ ⎛ x1+<br />
x<br />
′<br />
2<br />
= β −<br />
⎞<br />
⎜ x ⎟ (7)<br />
2 ⎝ 2 ⎠<br />
2