


Create successful ePaper yourself
Turn your PDF publications into a flip-book with our unique Google optimized e-Paper software.
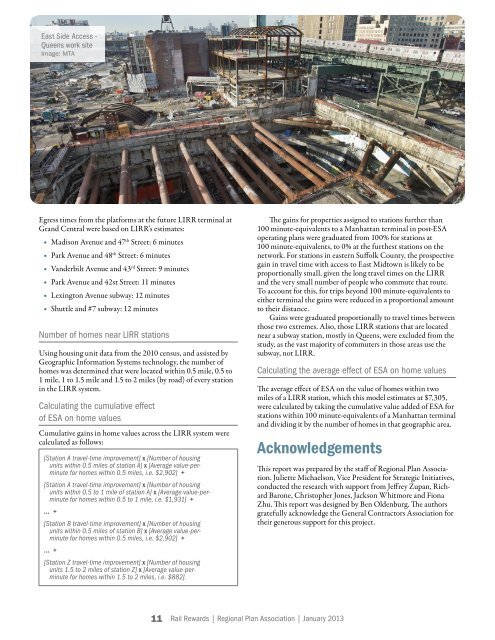
East Side Access -<br />
Queens work site<br />
Image: MTA<br />
Egress times from the platforms at the future LIRR terminal at<br />
Grand Central were based on LIRR’s estimates:<br />
• Madison Avenue and 47 th Street: 6 minutes<br />
• Park Avenue and 48 th Street: 6 minutes<br />
• Vanderbilt Avenue and 43 rd Street: 9 minutes<br />
• Park Avenue and 42st Street: 11 minutes<br />
• Lexington Avenue subway: 12 minutes<br />
• Shuttle and #7 subway: 12 minutes<br />
Number of homes near LIRR stations<br />
Using housing unit data from the 2010 census, and assisted by<br />
Geographic Information Systems technology, the number of<br />
homes was determined that were located within 0.5 mile, 0.5 to<br />
1 mile, 1 to 1.5 mile and 1.5 to 2 miles (by road) of every station<br />
in the LIRR system.<br />
Calculating the cumulative effect<br />
of ESA on home values<br />
Cumulative gains in home values across the LIRR system were<br />
calculated as follows:<br />
[Station A travel-time improvement] x [Number of housing<br />
units within 0.5 miles of station A] x [Average value-perminute<br />
for homes within 0.5 miles, i.e. $2,902] +<br />
[Station A travel-time improvement] x [Number of housing<br />
units within 0.5 to 1 mile of station A] x [Average value-perminute<br />
for homes within 0.5 to 1 mile, i.e. $1,931] +<br />
… +<br />
[Station B travel-time improvement] x [Number of housing<br />
units within 0.5 miles of station B] x [Average value-perminute<br />
for homes within 0.5 miles, i.e. $2,902] +<br />
… +<br />
[Station Z travel-time improvement] x [Number of housing<br />
units 1.5 to 2 miles of station Z] x [Average value-perminute<br />
for homes within 1.5 to 2 miles, i.e. $882].<br />
The gains for properties assigned to stations further than<br />
100 minute-equivalents to a Manhattan terminal in post-ESA<br />
operating plans were graduated from 100% for stations at<br />
100 minute-equivalents, to 0% at the furthest stations on the<br />
network. For stations in eastern Suffolk County, the prospective<br />
gain in travel time with access to East Midtown is likely to be<br />
proportionally small, given the long travel times on the LIRR<br />
and the very small number of people who commute that route.<br />
To account for this, for trips beyond 100 minute-equivalents to<br />
either terminal the gains were reduced in a proportional amount<br />
to their distance.<br />
Gains were graduated proportionally to travel times between<br />
those two extremes. Also, those LIRR stations that are located<br />
near a subway station, mostly in Queens, were excluded from the<br />
study, as the vast majority of commuters in those areas use the<br />
subway, not LIRR.<br />
Calculating the average effect of ESA on home values<br />
The average effect of ESA on the value of homes within two<br />
miles of a LIRR station, which this model estimates at $7,305,<br />
were calculated by taking the cumulative value added of ESA for<br />
stations within 100 minute-equivalents of a Manhattan terminal<br />
and dividing it by the number of homes in that geographic area.<br />
Acknowledgements<br />
This report was prepared by the staff of Regional Plan Association.<br />
Juliette Michaelson, Vice President for Strategic Initiatives,<br />
conducted the research with support from Jeffrey Zupan, Richard<br />
Barone, Christopher Jones, Jackson Whitmore and Fiona<br />
Zhu. This report was designed by Ben Oldenburg. The authors<br />
gratefully acknowledge the General Contractors Association for<br />
their generous support for this project.<br />
11 <strong>Rail</strong> <strong>Rewards</strong> | Regional Plan Association | January 2013