

Ways to reduce your greenhouse gas emissions - GHG Energy Calc ...
Ways to reduce your greenhouse gas emissions - GHG Energy Calc ...
Ways to reduce your greenhouse gas emissions - GHG Energy Calc ...

Create successful ePaper yourself
Turn your PDF publications into a flip-book with our unique Google optimized e-Paper software.
DO YOU WANT MORE SCIENTIFIC EVIDENCE OF THE<br />
GREENHOUSE EFFECT AND GLOBAL WARMING?<br />
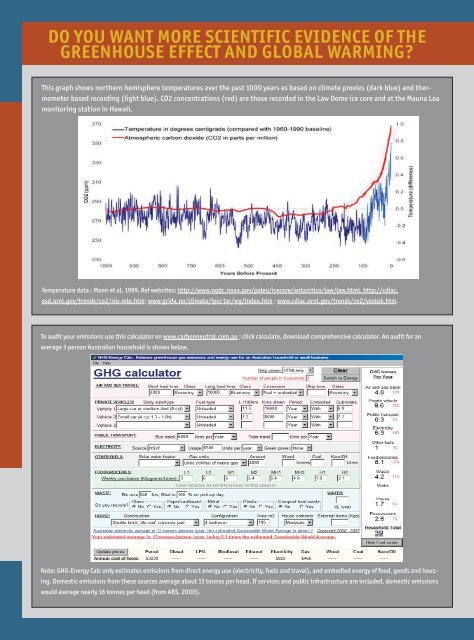
This graph shows northern hemisphere temperatures over the past 1000 years as based on climate proxies (dark blue) and thermometer<br />
based recording (light blue). CO2 concentrations (red) are those recorded in the Law Dome ice core and at the Mauna Loa<br />
moni<strong>to</strong>ring station in Hawaii.<br />
Temperature data : Mann et al, 1999. Ref websites: http://www.ngdc.noaa.gov/paleo/icecore/antarctica/law/law.html, http://cdiac.<br />
esd.ornl.gov/trends/co2/sio-mlo.htm; www.grida.no/climate/ipcc tar/wg/index.htm ; www.cdiac.ornl.gov/trends/co2/vos<strong>to</strong>k.htm.<br />
To audit <strong>your</strong> <strong>emissions</strong> use this calcula<strong>to</strong>r on www.carbonneutral.com.au ; click calculate, download comprehensive calcula<strong>to</strong>r. An audit for an<br />
average 3 person Australian household is shown below.<br />
Note: <strong>GHG</strong>-<strong>Energy</strong> <strong>Calc</strong> only estimates <strong>emissions</strong> from direct energy use (electricity, fuels and travel), and embodied energy of food, goods and housing.<br />
Domestic <strong>emissions</strong> from these sources average about 13 <strong>to</strong>nnes per head. If services and public infrastructure are included, domestic <strong>emissions</strong><br />
would average nearly 16 <strong>to</strong>nnes per head (from ABS, 2000).