APOLOGISMOS CCHBC final - Coca-Cola Hellenic
APOLOGISMOS CCHBC final - Coca-Cola Hellenic
APOLOGISMOS CCHBC final - Coca-Cola Hellenic

Create successful ePaper yourself
Turn your PDF publications into a flip-book with our unique Google optimized e-Paper software.
nvironment environment environment environment environment environment environment environment environment environment environment environment environment environment environment environment environm<br />
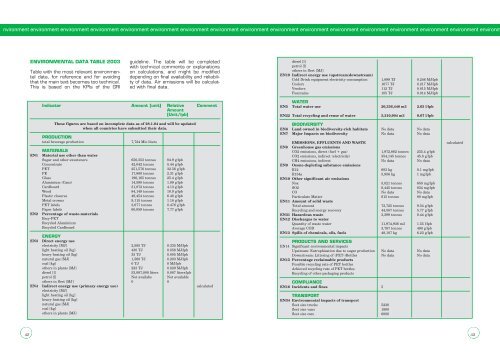
ENVIRONMENTAL DATA TABLE 2003<br />
Table with the most relevant environmental<br />
data, for reference and for avoiding<br />
that the main text becomes too technical.<br />
This is based on the KPIs of the GRI<br />
guideline. The table will be completed<br />
with technical comments or explanations<br />
on calculations, and might be modified<br />
depending on <strong>final</strong> availability and reliability<br />
of data. Air emissions will be calculated<br />
with <strong>final</strong> data.<br />
diesel [l]<br />
petrol [l]<br />
others in fleet [MJ]<br />
EN19 Indirect energy use (upstream/downstream)<br />
Cold Drink equipment electricity consumption 1,899 TJ 0.246 MJ/lpb<br />
Coolers 1677 TJ 0.217 MJ/lpb<br />
Vendors 112 TJ 0.015 MJ/lpb<br />
Fountains 105 TJ 0.014 MJ/lpb<br />
EN1<br />
EN2<br />
Indicator Amount [unit] Relative Comment<br />
Amount<br />
[Unit/lpb]<br />
These figures are based on incomplete data as of 28.1.04 and will be updated<br />
when all countries have submitted their data.<br />
PRODUCTION<br />
total beverage production<br />
7,724 Mio liters<br />
MATERIALS<br />
Material use other than water<br />
Sugar and other sweeteners 656,353 tonnes 84.9 g/lpb<br />
Concentrate 42,042 tonnes 5.44 g/lpb<br />
PET 251,576 tonnes 32.56 g/lpb<br />
PE 17,880 tonnes 2.31 g/lpb<br />
Glass 196,165 tonnes 25.4 g/lpb<br />
Aluminium (Cans) 14,598 tonnes 1.89 g/lpb<br />
Cardboard 31,872 tonnes 4.13 g/lpb<br />
Wood 84,149 tonnes 10.9 g/lpb<br />
Plastic closures 49,454 tonnes 6.40 g/lpb<br />
Metal crowns 9,115 tonnes 1.18 g/lpb<br />
PET labels 3,677 tonnes 0.476 g/lpb<br />
Paper labels 60,059 tonnes 7.77 g/lpb<br />
Percentage of waste-materials<br />
Recy-PET<br />
Recycled Aluminium<br />
Recycled Cardboard<br />
ENERGY<br />
EN3 Direct energy use<br />
electricity [MJ] 2,585 TJ 0.335 MJ/lpb<br />
light heating oil [kg] 430 TJ 0.056 MJ/lpb<br />
heavy heating oil [kg] 35 TJ 0.005 MJ/lpb<br />
natural gas [MJ] 1,568 TJ 0.203 MJ/lpb<br />
coal [kg] 0 TJ 0 MJ/lpb<br />
others in plants [MJ] 223 TJ 0.029 MJ/lpb<br />
diesel [l] 53,087,000 liters 0.007 liters/lpb<br />
petrol [l] Not availabe Not available<br />
others in fleet [MJ] 0 0<br />
EN4 Indirect energy use (primary energy use) calculated<br />
electricity [MJ]<br />
light heating oil [kg]<br />
heavy heating oil [kg]<br />
natural gas [MJ]<br />
coal [kg]<br />
others in plants [MJ]<br />
WATER<br />
EN5 Total water use 20,336,448 m3 2.63 l/lpb<br />
EN22 Total recycling and reuse of water 5,210,904 m3 0.67 l/lpb<br />
BIODIVERSITY<br />
EN6 Land owned in biodiversity-rich habitats No data No data<br />
EN7 Major Impacts on biodiversity No data No data<br />
EMISSIONS, EFFLUENTS AND WASTE<br />
EN8 Greenhouse gas emissions<br />
CO2 emissions, direct (fuel + gas) 1,972,882 tonnes 255.4 g/lpb<br />
CO2 emissions, indirect (electricity) 354,145 tonnes 45.8 g/lpb<br />
CH4 emissions, indirect No data No data<br />
EN9 Ozone-depleting substance emissions<br />
R12 683 kg 0.1 mg/lpb<br />
R134a 5,956 kg 1 mg/lpb<br />
EN10 Other significant air emissions<br />
Nox 5,021 tonnes 650 mg/lpb<br />
SO2 6,445 tonnes 834 mg/lpb<br />
CO No data No data<br />
Particulate Matter 615 tonnes 80 mg/lpb<br />
EN11 Amount of solid waste<br />
Total amount 73,725 tonnes 9.54 g/lpb<br />
Recycling and energy recovery 44,587 tonnes 5.77 g/lpb<br />
EN31 Hazardous waste 3,399 tonnes 0.44 g/lpb<br />
EN12 Discharges to water<br />
Quantity of waste water 11,974,936 m3 1.55 l/lpb<br />
Average COD 3,787 tonnes 490 g/lpb<br />
EN13 Spills of chemicals, oils, fuels 48,107 kg 6.23 g/lpb<br />
PRODUCTS AND SERVICES<br />
EN14 Significant environmental impacts<br />
Upstream: Eutrophisation due to sugar production No data No data<br />
Downstream: Littering of (PET-)Bottles No data No data<br />
EN15 Percentage reclaimable products<br />
Possible recycling rate of PET bottles<br />
Achieved recycling rate of PET bottles<br />
Recycling of other packaging products<br />
COMPLIANCE<br />
EN16 Incidents and fines 5<br />
TRANSPORT<br />
EN34 Environmental impacts of transport<br />
fleet size trucks 5230<br />
fleet size vans 1800<br />
fleet size cars 6000<br />
calculated<br />
42<br />
43