Hoard: A Scalable Memory Allocator for Multithreaded Applications
Hoard: A Scalable Memory Allocator for Multithreaded Applications
Hoard: A Scalable Memory Allocator for Multithreaded Applications

Create successful ePaper yourself
Turn your PDF publications into a flip-book with our unique Google optimized e-Paper software.
emains within its empty fraction <strong>for</strong> most of the rest of its run<br />
(dropping below only a few times over a 30-second run and over<br />
27 million mallocs) so that <strong>Hoard</strong> incurs very low synchronization<br />
costs. Despite the fact that Larson transfers many objects from one<br />
thread to another, <strong>Hoard</strong> per<strong>for</strong>ms quite well. All of the other allocators<br />
fail to scale at all, running slower on 14 processors than on<br />
one processor.<br />
Barnes-Hut is a hierarchical n-body particle solver included with<br />
the Hood user-level multiprocessor threads library [1, 2], run on<br />
32,768 particles <strong>for</strong> 20 rounds. This application per<strong>for</strong>ms a small<br />
amount of dynamic memory allocation during the tree-building phase.<br />
With 14 processors, all of the multiple-heap allocators provide a<br />
10% per<strong>for</strong>mance improvement, increasing the speedup of the application<br />
from less than 10 to just above 12 (see Figure 3(d)). <strong>Hoard</strong><br />
per<strong>for</strong>ms only slightly better than Ptmalloc in this case because<br />
this program does not exercise the allocator much. <strong>Hoard</strong>’s per<strong>for</strong>mance<br />
is probably somewhat better simply because Barnes-Hut<br />
never drops below its empty fraction during its execution.<br />
The BEMengine benchmark uses the solver engine from Coyote<br />
Systems’ BEMSolver [7], a 2D/3D field solver that can solve electrostatic,<br />
magnetostatic and thermal systems. We report speedup<br />
<strong>for</strong> the three mostly-parallel parts of this code (equation registration,<br />
preconditioner creation, and the solver). Figure 3(e) shows<br />
that <strong>Hoard</strong> provides a significant runtime advantage over Ptmalloc<br />
and the Solaris allocator (MTmalloc caused the application to raise<br />
a fatal exception). During the first two phases of the program, the<br />
program’s memory usage dropped below the empty fraction only<br />
25 times over 50 seconds, leading to low synchronization overhead.<br />
This application causes Ptmalloc to exhibit pathological behavior<br />
that we do not understand, although we suspect that it derives from<br />
false sharing. During the execution of the solver phase of the computation,<br />
as seen in Figure 3(f), contention in the allocator is not<br />
an issue, and both <strong>Hoard</strong> and the Solaris allocator per<strong>for</strong>m equally<br />
well.<br />
5.3 False sharing avoidance<br />
The active-false benchmark tests whether an allocator avoids actively<br />
inducing false sharing. Each thread allocates one small object,<br />
writes on it a number of times, and then frees it. The rate of<br />
memory allocation is low compared to the amount of work done,<br />
so this benchmark only tests contention caused by the cache coherence<br />
mechanism (cache ping-ponging) and not allocator contention.<br />
While <strong>Hoard</strong> scales linearly, showing that it avoids actively<br />
inducing false sharing, both Ptmalloc and MTmalloc only scale up<br />
to about 4 processors because they actively induce some false sharing.<br />
The Solaris allocator does not scale at all because it actively<br />
induces false sharing <strong>for</strong> nearly every cache line.<br />
The passive-false benchmark tests whether an allocator avoids<br />
both passive and active false sharing by allocating a number of<br />
small objects and giving one to each thread, which immediately<br />
frees the object. The benchmark then continues in the same way as<br />
the active-false benchmark. If the allocator does not coalesce the<br />
pieces of the cache line initially distributed to the various threads,<br />
it passively induces false sharing. Figure 4(b) shows that <strong>Hoard</strong><br />
scales nearly linearly; the gradual slowdown after 12 processors is<br />
due to program-induced bus traffic. Neither Ptmalloc nor MTmalloc<br />
avoid false sharing here, but the cause could be either active or<br />
passive false sharing.<br />
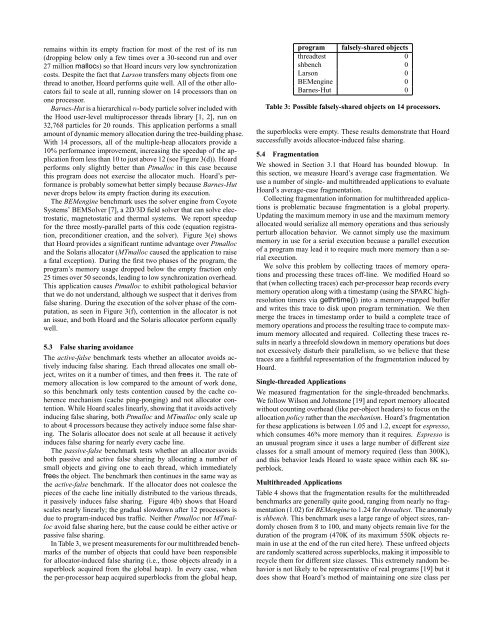
In Table 3, we present measurements <strong>for</strong> our multithreaded benchmarks<br />
of the number of objects that could have been responsible<br />
<strong>for</strong> allocator-induced false sharing (i.e., those objects already in a<br />
superblock acquired from the global heap). In every case, when<br />
the per-processor heap acquired superblocks from the global heap,<br />
program falsely-shared objects<br />
threadtest 0<br />
shbench 0<br />
Larson 0<br />
BEMengine 0<br />
Barnes-Hut 0<br />
Table 3: Possible falsely-shared objects on 14 processors.<br />
the superblocks were empty. These results demonstrate that <strong>Hoard</strong><br />
successfully avoids allocator-induced false sharing.<br />
5.4 Fragmentation<br />
We showed in Section 3.1 that <strong>Hoard</strong> has bounded blowup. In<br />
this section, we measure <strong>Hoard</strong>’s average case fragmentation. We<br />
use a number of single- and multithreaded applications to evaluate<br />
<strong>Hoard</strong>’s average-case fragmentation.<br />
Collecting fragmentation in<strong>for</strong>mation <strong>for</strong> multithreaded applications<br />
is problematic because fragmentation is a global property.<br />
Updating the maximum memory in use and the maximum memory<br />
allocated would serialize all memory operations and thus seriously<br />
perturb allocation behavior. We cannot simply use the maximum<br />
memory in use <strong>for</strong> a serial execution because a parallel execution<br />
of a program may lead it to require much more memory than a serial<br />
execution.<br />
We solve this problem by collecting traces of memory operations<br />
and processing these traces off-line. We modified <strong>Hoard</strong> so<br />
that (when collecting traces) each per-processor heap records every<br />
memory operation along with a timestamp (using the SPARC highresolution<br />
timers via gethrtime()) into a memory-mapped buffer<br />
and writes this trace to disk upon program termination. We then<br />
merge the traces in timestamp order to build a complete trace of<br />
memory operations and process the resulting trace to compute maximum<br />
memory allocated and required. Collecting these traces results<br />
in nearly a threefold slowdown in memory operations but does<br />
not excessively disturb their parallelism, so we believe that these<br />
traces are a faithful representation of the fragmentation induced by<br />
<strong>Hoard</strong>.<br />
Single-threaded <strong>Applications</strong><br />
We measured fragmentation <strong>for</strong> the single-threaded benchmarks.<br />
We follow Wilson and Johnstone [19] and report memory allocated<br />
without counting overhead (like per-object headers) to focus on the<br />
allocation policy rather than the mechanism. <strong>Hoard</strong>’s fragmentation<br />
<strong>for</strong> these applications is between 1.05 and 1.2, except <strong>for</strong> espresso,<br />
which consumes 46% more memory than it requires. Espresso is<br />
an unusual program since it uses a large number of different size<br />
classes <strong>for</strong> a small amount of memory required (less than 300K),<br />
and this behavior leads <strong>Hoard</strong> to waste space within each 8K superblock.<br />
<strong>Multithreaded</strong> <strong>Applications</strong><br />
Table 4 shows that the fragmentation results <strong>for</strong> the multithreaded<br />
benchmarks are generally quite good, ranging from nearly no fragmentation<br />
(1.02) <strong>for</strong> BEMengine to 1.24 <strong>for</strong> threadtest. The anomaly<br />
is shbench. This benchmark uses a large range of object sizes, randomly<br />
chosen from 8 to 100, and many objects remain live <strong>for</strong> the<br />
duration of the program (470K of its maximum 550K objects remain<br />
in use at the end of the run cited here). These unfreed objects<br />
are randomly scattered across superblocks, making it impossible to<br />
recycle them <strong>for</strong> different size classes. This extremely random behavior<br />
is not likely to be representative of real programs [19] but it<br />
does show that <strong>Hoard</strong>’s method of maintaining one size class per