Download PDF - Voith Turbo
Download PDF - Voith Turbo
Download PDF - Voith Turbo

Create successful ePaper yourself
Turn your PDF publications into a flip-book with our unique Google optimized e-Paper software.
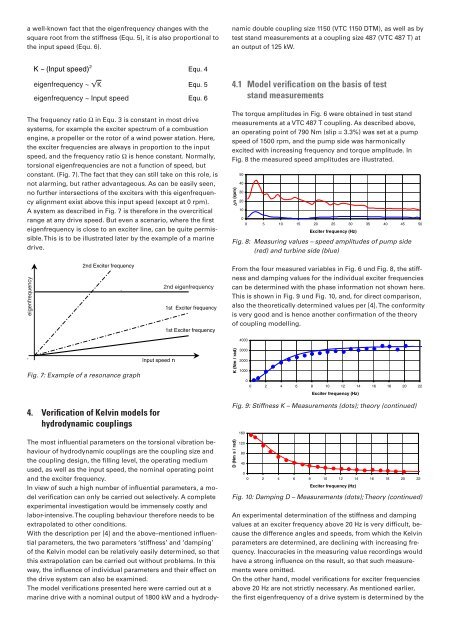
a well-known fact that the eigenfrequency changes with the<br />
square root from the stiffness (Equ. 5), it is also proportional to<br />
the input speed (Equ. 6).<br />
The most influential parameters on the torsional vibration behaviour<br />
of hydrodynamic couplings are the coupling size and<br />
the coupling design, the filling level, the operating medium<br />
used, as well as the input speed, the nominal operating point<br />
and the exciter frequency.<br />
In view of such a high number of influential parameters, a model<br />
verification can only be carried out selectively. A complete<br />
experimental investigation would be immensely costly and<br />
labor-intensive. The coupling behaviour therefore needs to be<br />
extrapolated to other conditions.<br />
With the description per [4] and the above–mentioned influential<br />
parameters, the two parameters ‘stiffness’ and ‘damping’<br />
of the Kelvin model can be relatively easily determined, so that<br />
this extrapolation can be carried out without problems. In this<br />
way, the influence of individual parameters and their effect on<br />
the drive system can also be examined.<br />
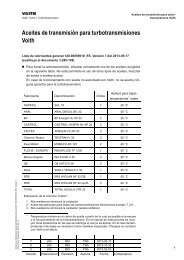
The model verifications presented here were carried out at a<br />
marine drive with a nominal output of 1800 kW and a hydrodynamic<br />
double coupling size 1150 (VTC 1150 DTM), as well as by<br />
test stand measurements at a coupling size 487 (VTC 487 T) at<br />
an output of 125 kW.<br />
2<br />
K ~ (Input speed)<br />
Equ. 4<br />
Inherent eigenfrequency ∼ √K ~ K<br />
Equ. 5<br />
Inherent eigenfrequency ∼ Input ~ Input speed speed<br />
Equ. 6<br />
The frequency ratio Ω in Equ. 3 is constant in most drive<br />
systems, for example the exciter spectrum of a combustion<br />
en gine, a propeller or the rotor of a wind power station. Here,<br />
the exciter frequencies are always in proportion to the input<br />
speed, and the frequency ratio Ω is hence constant. Normally,<br />
torsional eigenfrequencies are not a function of speed, but<br />
constant. (Fig. 7). The fact that they can still take on this role, is<br />
not alarming, but rather advantageous. As can be easily seen,<br />
no further intersections of the exciters with this eigenfrequency<br />
alignment exist above this input speed (except at 0 rpm).<br />
A system as described in Fig. 7 is therefore in the overcritical<br />
range at any drive speed. But even a scenario, where the first<br />
eigenfrequency is close to an exciter line, can be quite permissible.<br />
This is to be illustrated later by the example of a marine<br />
drive.<br />
4.1 Model verification on the basis of test<br />
stand measurements<br />
∆Τ<br />
The torque amplitudes in Fig. 6 were obtained in test stand<br />
measurements at a VTC 487 T coupling. As described above,<br />
an operating point of 790 Nm (slip = 3.3%) was set at a pump<br />
speed of 1500 rpm, and the pump side was harmonically<br />
excited with increasing frequency and torque amplitude. In<br />
Fig. 8 the measured speed amplitudes are illustrated.<br />
∆n (rpm) ∆Τ<br />
50<br />
40<br />
30<br />
20<br />
10<br />
0<br />
0 5 10 15 20 25 30 35 40 45 50<br />
Exciter frequency (Hz)<br />
Fig. 8: Measuring values – speed amplitudes of pump side<br />
(red) and turbine side (blue)<br />
eigenfrequency<br />
Inh. 2nd Exciter frequency<br />
.<br />
2nd eigenfrequency<br />
Inherent 1st Exciter frequency<br />
1st Exciter frequency<br />
From the four measured variables in Fig. 6 und Fig. 8, the stiffness<br />
and damping values for the individual exciter frequencies<br />
can be determined with the phase information not shown here.<br />
This is shown in Fig. 9 und Fig. 10, and, for direct comparison,<br />
also the theoretically determined values per [4]. The conformity<br />
is very good and is hence another confirmation of the theory<br />
of coupling modelling.<br />
∆<br />
4000<br />
.<br />
Fig. 7: Example of a resonance graph<br />
Input speed n<br />
K (Nm / rad)<br />
3000<br />
2000<br />
1000<br />
0<br />
0 2 4 6 8 10 12 14 16 18 20 22<br />
Exciter frequency (Hz)<br />
4. Verification of Kelvin models for<br />
hydrodynamic couplings<br />
Fig. 9: Stiffness K – Measurements (dots); theory (continued)<br />
D (Nm s / rad)<br />
160<br />
120<br />
80<br />
40<br />
0<br />
0 2 4 6 8 10 12 14 16 18 20 22<br />
Exciter frequency (Hz)<br />
Fig. 10: Damping D – Measurements (dots); Theory (continued)<br />
An experimental determination of the stiffness and damping<br />
values at an exciter frequency above 20 Hz is very difficult, because<br />
the difference angles and speeds, from which the Kelvin<br />
parameters are determined, are declining with increasing frequency.<br />
Inaccuracies in the measuring value recordings would<br />
have a strong influence on the result, so that such measurements<br />
were omitted.<br />
η<br />
On the other hand, model verifications for exciter frequencies<br />
above 20 Hz are not strictly necessary. As mentioned earlier,<br />
the first eigenfrequency of a drive system is determined by the