- Page 1 and 2: This content is copyright Flat Worl
- Page 3 and 4: Government Policy End-of-Chapter Ma
- Page 5 and 6: may never take another economics co
- Page 7 and 8: see small groups of people sitting
- Page 9 and 10: CHECKING YOUR UNDERSTANDING 1. List
- Page 11 and 12: you something about how to make bet
- Page 13 and 14: all the different things you like b
- Page 15 and 16: As the game was drawing to a close,
- Page 17 and 18: pollution in Mexico City is in part
- Page 19 and 20: In Conclusion Our book is built aro
- Page 21 and 22: We start with the decision about ho
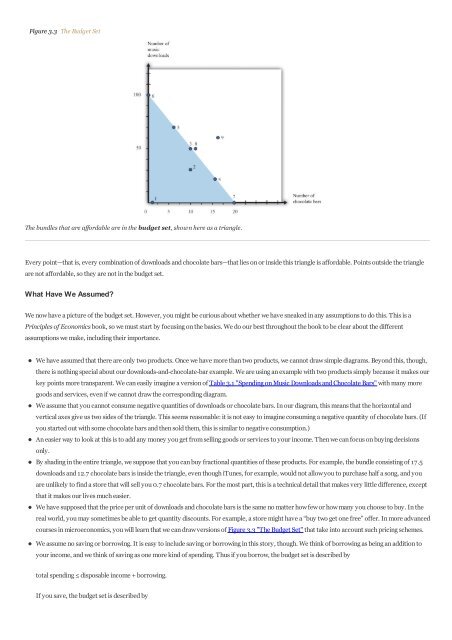
- Page 23: Bundle 6 shows that, if you chose t
- Page 27 and 28: Economists don’t pretend to know
- Page 29 and 30: point. We see what people do, not t
- Page 31 and 32: CHECKING YOUR UNDERSTANDING 1. Supp
- Page 33 and 34: smaller quantity of instant noodles
- Page 35 and 36: Figure 3.9 The Demand Curve Table 3
- Page 37 and 38: example: if the price of CDs increa
- Page 39 and 40: You have a similar decision rule fo
- Page 41 and 42: Figure 3.13 The Valuation of a Car
- Page 43 and 44: CHECKING YOUR UNDERSTANDING 1. Thin
- Page 45 and 46: So Figure 3.14 "The Time Budget Con
- Page 47 and 48: Toolkit: Section 17.3 "The Labor Ma
- Page 49 and 50: CHECKING YOUR UNDERSTANDING 1. If y
- Page 51 and 52: 9. (Advanced) Suppose the governmen
- Page 53 and 54: LEARNING OBJECTIVES 1. What is your
- Page 55 and 56: Figure 4.2 The Budget Line with Two
- Page 57 and 58: The Position of the Budget Line Whe
- Page 59 and 60: Toolkit: Section 17.4 "Choices over
- Page 61 and 62: Saving and Borrowing Your preferred
- Page 63 and 64: Toolkit: Section 17.5 "Discounted P
- Page 65 and 66: Figure 4.8 Individual Loan Supply F
- Page 67 and 68: Similarly, the discounted present v
- Page 69 and 70: are added over one’s lifetime. Se
- Page 71 and 72: years. Cars and kitchen appliances
- Page 73 and 74: Table 4.8 Coin-Flipping Experiment
- Page 75 and 76:
Diversification of Risk In many cas
- Page 77 and 78:
jobs. The unemployment rate is the
- Page 79 and 80:
Figure 4.11 Work Fatalities in the
- Page 81 and 82:
Lottery Games Odds Calculator,” a
- Page 83 and 84:
EXERCISES 1. Explain why an increas
- Page 85 and 86:
Figure 5.1 The eBay Home Page In or
- Page 87 and 88:
Road Map The chapter falls naturall
- Page 89 and 90:
Figure 5.3 The Buyer’s Valuation
- Page 91 and 92:
Figure 5.5 Buyer and Seller Valuati
- Page 93 and 94:
1. The seller knows the buyer’s v
- Page 95 and 96:
You participate as a buyer in an eB
- Page 97 and 98:
transferred from someone who values
- Page 99 and 100:
Double Oral Auctions In a double or
- Page 101 and 102:
Figure 5.11 Obtaining the Market Su
- Page 103 and 104:
Figure 5.13 Supply and Demand When
- Page 105 and 106:
Figure 5.15 Surplus in Equilibrium
- Page 107 and 108:
Inspired by the craigslist posts th
- Page 109 and 110:
Toolkit: Section 17.12 "Production
- Page 111 and 112:
Figure 5.20 Hannah’s Production P
- Page 113 and 114:
Figure 5.22 Julio and Hannah’s Pr
- Page 115 and 116:
frontier has slope −3/2, as Hanna
- Page 117 and 118:
EXERCISES 1. Would you expect to ge
- Page 119 and 120:
6.1 The Goal of a Firm LEARNING OBJ
- Page 121 and 122:
Figure 6.3 The Profits of a Firm We
- Page 123 and 124:
Price ($) Quantity 0 100 2 90 4 80
- Page 125 and 126:
Figure 6.6 The Elasticity of Demand
- Page 127 and 128:
Figure 6.8 Finding the Demand Curve
- Page 129 and 130:
Figure 6.10 Revenues Gained and Los
- Page 131 and 132:
Figure 6.12 Marginal Revenue and De
- Page 133 and 134:
CHECKING YOUR UNDERSTANDING 1. Earl
- Page 135 and 136:
Figure 6.15 An Example of a Cost Fu
- Page 137 and 138:
Figure 6.17 Setting the Price or Se
- Page 139 and 140:
4. If the optimal price is less tha
- Page 141 and 142:
6.5 The Supply Curve of a Competiti
- Page 143 and 144:
Table 6.5 Costs of Production: Incr
- Page 145 and 146:
EXERCISES 1. We suggested that a gr
- Page 147 and 148:
Tigers’ Merchandise Off to Roarin
- Page 149 and 150:
One way to summarize this behavior
- Page 151 and 152:
We typically expect that marginal c
- Page 153 and 154:
Figure 7.5 Market Equilibrium In a
- Page 155 and 156:
Figure 7.6 A Shift in the Supply Cu
- Page 157 and 158:
Comparative Statics The approach th
- Page 159 and 160:
the conclusion that the news should
- Page 161 and 162:
But this is exactly what happens in
- Page 163 and 164:
The example in Table 7.4 "Calculati
- Page 165 and 166:
Figure 7.15 Surplus Away from the M
- Page 167 and 168:
The demand for credit decreases as
- Page 169 and 170:
Toolkit: Section 17.3 "The Labor Ma
- Page 171 and 172:
KEY TAKEAWAYS The supply-and-demand
- Page 173 and 174:
Figure 7.21 An Increase in Marginal
- Page 175 and 176:
KEY TAKEAWAYS Even if markets are n
- Page 177 and 178:
The supply-and-demand framework can
- Page 179 and 180:
Figure 8.2 Walmart: Growing Jobs? S
- Page 181 and 182:
demand in the labor market. In the
- Page 183 and 184:
Figure 8.5 The Technology of a Firm
- Page 185 and 186:
marginal product of labor. In creat
- Page 187 and 188:
Figure 8.8 The Cost Function The co
- Page 189 and 190:
We can see from this equation that
- Page 191 and 192:
Figure 8.12 The Effect of a Change
- Page 193 and 194:
Figure 8.14 The Effect of a Change
- Page 195 and 196:
Production" are based on the follow
- Page 197 and 198:
Suppose you ask this question just
- Page 199 and 200:
Specifically, we can divide entry c
- Page 201 and 202:
to a job offer is very important fo
- Page 203 and 204:
Another source of bargaining power
- Page 205 and 206:
Steven J. Davis, John C. Haltiwange
- Page 207 and 208:
EXERCISES 1. A statistic called “
- Page 209 and 210:
Road Map This chapter begins with a
- Page 211 and 212:
stocks traded in an exchange that s
- Page 213 and 214:
The Foreign Exchange Market Further
- Page 215 and 216:
Toolkit: Section 17.5 "Discounted P
- Page 217 and 218:
Outcome (Number of Oranges) Probabi
- Page 219 and 220:
KEY TAKEAWAYS The value of an asset
- Page 221 and 222:
The supply side is shown in part (a
- Page 223 and 224:
We have also discovered that, in ge
- Page 225 and 226:
There are a couple of possible answ
- Page 227 and 228:
caution: even if markets are not al
- Page 229 and 230:
Figure 9.9 Equilibrium Asset Prices
- Page 231 and 232:
EXERCISES 1. List the factors you t
- Page 233 and 234:
Burger King in Georgia or Arby’s
- Page 235 and 236:
Road Map Because the minimum wage s
- Page 237 and 238:
The first increment of the proposal
- Page 239 and 240:
wage or the real equilibrium quanti
- Page 241 and 242:
Inflation and the Minimum Wage Alth
- Page 243 and 244:
In part (a) of Figure 10.9 "Deadwei
- Page 245 and 246:
Figure 10.11 The Employment Effect
- Page 247 and 248:
To talk about distribution, we need
- Page 249 and 250:
Figure 10.14 Effects of an Increase
- Page 251 and 252:
LEARNING OBJECTIVES 1. How do econo
- Page 253 and 254:
adults.) Figure 10.18 "Teenage Unem
- Page 255 and 256:
economists, particularly because th
- Page 257 and 258:
EXERCISES 1. List three jobs you th
- Page 259 and 260:
some value. In addition, if the mar
- Page 261 and 262:
29, 2007, accessed January 29, 2011
- Page 263 and 264:
Toolkit: Section 17.11 "Efficiency
- Page 265 and 266:
possible to start bringing supplies
- Page 267 and 268:
Suppose you want to purchase a book
- Page 269 and 270:
In part (a) of Figure 11.9 "Tax Inc
- Page 271 and 272:
looked at. Figure 11.12 The Differe
- Page 273 and 274:
Figure 11.13 The Production Possibi
- Page 275 and 276:
Tariffs Where quotas are the equiva
- Page 277 and 278:
unable to migrate, then the equilib
- Page 279 and 280:
“Hiding in the Shadows: The Growt
- Page 281 and 282:
EXERCISES 1. List three additional
- Page 283 and 284:
including taxes on the income peopl
- Page 285 and 286:
Figure 12.2 The Lorenz Curve The mo
- Page 287 and 288:
Table 12.4 "Gini Coefficient over T
- Page 289 and 290:
Measure 1989 Quintile 1994 Quintile
- Page 291 and 292:
KEY TAKEAWAYS The Lorenz curve show
- Page 293 and 294:
skills, but these are much more com
- Page 295 and 296:
Economic forces can mitigate discri
- Page 297 and 298:
CHECKING YOUR UNDERSTANDING 1. Draw
- Page 299 and 300:
Toolkit: Section 17.6 "The Credit M
- Page 301 and 302:
means that the total number of choc
- Page 303 and 304:
Incentives Redistribution is more t
- Page 305 and 306:
Not all transfers are public; some
- Page 307 and 308:
EXERCISES 1. Draw a Lorenz curve fo
- Page 309 and 310:
the Cuyahoga River in Ohio was so p
- Page 311 and 312:
We will get to Mexico City shortly.
- Page 313 and 314:
Social Dilemma Air pollution and se
- Page 315 and 316:
the time of other drivers on the ro
- Page 317 and 318:
associated with production by a fir
- Page 319 and 320:
permits from others. A firm with mo
- Page 321 and 322:
egulators simply need to calculate
- Page 323 and 324:
In 1999, the United Nations held an
- Page 325 and 326:
price of oil will increase. This is
- Page 327 and 328:
I am not at all prepared to dismiss
- Page 329 and 330:
excludable, then a modified version
- Page 331 and 332:
EXERCISES 1. In the example about s
- Page 333 and 334:
Busting Up Monopolies Working for A
- Page 335 and 336:
Figure 14.1 The Competitive Market
- Page 337 and 338:
When a firm is maximizing its profi
- Page 339 and 340:
Standard Oil Trust in 1911.Justia.c
- Page 341 and 342:
A jury trial led to an award of $4.
- Page 343 and 344:
monopoly profits. Notice that a fir
- Page 345 and 346:
current prices. This problem is esp
- Page 347 and 348:
demand curve. If firm A sets a pric
- Page 349 and 350:
Figure 14.7 The Payoffs (Profits) f
- Page 351 and 352:
Figure 14.9 The Demand Curve Facing
- Page 353 and 354:
Figure 14.12 The Markets for Both F
- Page 355 and 356:
authorities are too permissive in a
- Page 357 and 358:
EXERCISES 1. Suppose you have two t
- Page 359 and 360:
One hundred years ago, our knowledg
- Page 361 and 362:
lies further to the left than the s
- Page 363 and 364:
Our diet also affects our probabili
- Page 365 and 366:
jobs are in service occupations. Th
- Page 367 and 368:
Figure 15.4 Payments to Hospitals a
- Page 369 and 370:
Toolkit: Section 17.7 "Expected Val
- Page 371 and 372:
Adverse Selection One complication
- Page 373 and 374:
more than you would if you had to p
- Page 375 and 376:
firms to earn a return on this inve
- Page 377 and 378:
KEY TAKEAWAYS Government interventi
- Page 379 and 380:
EXERCISES 1. Is health insurance a
- Page 381 and 382:
delay the purchase of a new car, ch
- Page 383 and 384:
(There is a subtlety you may be won
- Page 385 and 386:
Figure 16.3 "The Incidence of a Tax
- Page 387 and 388:
Figure 16.4 Idealized Effect of Goo
- Page 389 and 390:
What was the sticker price of the c
- Page 391 and 392:
Pricing is only one of many decisio
- Page 393 and 394:
pattern of trade is quite normal: m
- Page 395 and 396:
didn’t warn you.” When you see
- Page 397 and 398:
United States in 1978 and ultimatel
- Page 399 and 400:
Key Links GM: http://www.gm.com/cor
- Page 401 and 402:
Chapter 17 Microeconomics Toolkit I
- Page 403 and 404:
Figure 17.1 Individual Demand The M
- Page 405 and 406:
Figure 17.2 Labor Market Equilibriu
- Page 407 and 408:
next year” is $100. The value of
- Page 409 and 410:
For example, suppose you are offere
- Page 411 and 412:
Chapter 12 "Superstars" Chapter 16
- Page 413 and 414:
Chapter 15 "A Healthy Economy" 17.1
- Page 415 and 416:
market. Tax incidence is the way in
- Page 417 and 418:
Key Insights The production possibi
- Page 419 and 420:
Figure 17.11 Cost Measures Figure 1
- Page 421 and 422:
Comparative statics is a tool used
- Page 423 and 424:
Key Insights The production functio
- Page 425 and 426:
The Main Uses of This Tool Chapter
- Page 427 and 428:
Key Insights As the exchange rate i
- Page 429:
The concept of correlation is quite