Advanced Poverty Analysis - MDP UCAD - Université Cheikh Anta ...
Advanced Poverty Analysis - MDP UCAD - Université Cheikh Anta ...
Advanced Poverty Analysis - MDP UCAD - Université Cheikh Anta ...
You also want an ePaper? Increase the reach of your titles
YUMPU automatically turns print PDFs into web optimized ePapers that Google loves.
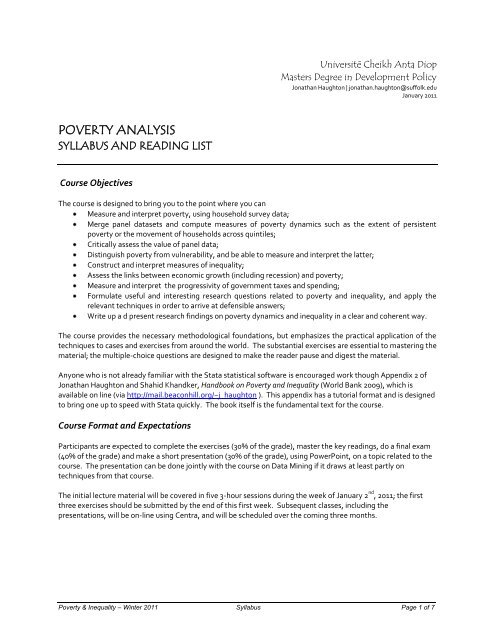
Université <strong>Cheikh</strong> <strong>Anta</strong> Diop<br />
Masters Degree in Development Policy<br />
Jonathan Haughton | jonathan.haughton@suffolk.edu<br />
January 2011<br />
POVERTY ANALYSIS<br />
SYLLABUS AND READING LIST<br />
Course Objectives<br />
The course is designed to bring you to the point where you can<br />
Measure and interpret poverty, using household survey data;<br />
Merge panel datasets and compute measures of poverty dynamics such as the extent of persistent<br />
poverty or the movement of households across quintiles;<br />
Critically assess the value of panel data;<br />
Distinguish poverty from vulnerability, and be able to measure and interpret the latter;<br />
Construct and interpret measures of inequality;<br />
Assess the links between economic growth (including recession) and poverty;<br />
Measure and interpret the progressivity of government taxes and spending;<br />
Formulate useful and interesting research questions related to poverty and inequality, and apply the<br />
relevant techniques in order to arrive at defensible answers;<br />
Write up a d present research findings on poverty dynamics and inequality in a clear and coherent way.<br />
The course provides the necessary methodological foundations, but emphasizes the practical application of the<br />
techniques to cases and exercises from around the world. The substantial exercises are essential to mastering the<br />
material; the multiple-choice questions are designed to make the reader pause and digest the material.<br />
Anyone who is not already familiar with the Stata statistical software is encouraged work though Appendix 2 of<br />
Jonathan Haughton and Shahid Khandker, Handbook on <strong>Poverty</strong> and Inequality (World Bank 2009), which is<br />
available on line (via http://mail.beaconhill.org/~j_haughton ). This appendix has a tutorial format and is designed<br />
to bring one up to speed with Stata quickly. The book itself is the fundamental text for the course.<br />
Course Format and Expectations<br />
Participants are expected to complete the exercises (30% of the grade), master the key readings, do a final exam<br />
(40% of the grade) and make a short presentation (30% of the grade), using PowerPoint, on a topic related to the<br />
course. The presentation can be done jointly with the course on Data Mining if it draws at least partly on<br />
techniques from that course.<br />
The initial lecture material will be covered in five 3-hour sessions during the week of January 2 nd , 2011; the first<br />
three exercises should be submitted by the end of this first week. Subsequent classes, including the<br />
presentations, will be on-line using Centra, and will be scheduled over the coming three months.<br />
<strong>Poverty</strong> & Inequality – Winter 2011 Syllabus Page 1 of 7
Topics and Reading List<br />
Module 1: Measures of Welfare and <strong>Poverty</strong><br />
In this module we ask what poverty is, why we need to measure it, and where the primary data come from. We<br />
evaluate different measures of welfare, including income and expenditure. Other topics include the use of<br />
sampling weights; adjusting for clustering; and equivalence scales.<br />
Learning objectives<br />
1) Summarize the three steps required to measure poverty.<br />
2) Recognize the strengths and limitations arising from the need to use survey data in poverty analysis, including the choice of sample<br />
frame, unit of observation, time period, and choice of welfare indicators.<br />
3) Describe the main problems that arise with survey data, including<br />
a) survey design (sampling frame/coverage, response bias),<br />
b) stratification, and<br />
c) multistage cluster sampling.<br />
4) Explain why weighting is needed when surveys use stratified random sampling.<br />
5) Describe and evaluate the use of equivalence scales (including the OECD scale).<br />
6) Define consumption and income as measures of welfare, and evaluate the desirability of each in the LDC context.<br />
7) Summarize the problems that arise in measuring income and consumption, and explain how to value durable goods, and housing<br />
services.<br />
8) Identify measures of household welfare other than consumption and income, including Calorie consumption per capita, nutritional<br />
status, health status, and food consumption as a proportion of total expenditure.<br />
9) Argue the case that there is no ideal measure of welfare.<br />
Materials<br />
Reading: Handbook on <strong>Poverty</strong> and Inequality, chapters 1 and 2.<br />
Chapter 1 is a short and straightforward summary of the main concepts of poverty, and the reasons why we should devote some<br />
resources to measuring poverty.<br />
Chapter 2 on Measuring <strong>Poverty</strong> first summarizes the sources of data on poverty; since most primary data come from household<br />
surveys that use stratified random sampling, the analysis of the resulting data needs to use weights to correct for the<br />
sampling procedures. The chapter then evaluates the most commonly-used measures of welfare, including income per<br />
capita and expenditure per capita. The poorest countries tend to measure poverty using expenditure per capita; Table<br />
2.6 provides a useful summary of discussion about whether income or expenditure is a better measure to use.<br />
Quiz: The short quiz tests one’s comprehension of chapter 2. It does not take long to answer, but it is useful in reinforcing the ideas in<br />
the chapter.<br />
Exercises: This exercise (which is a shorter version of Exercise 1 in Appendix 3 of the Handbook) should be completed and handed in or sent to<br />
me by e-mail. You are welcome to work on this exercise in groups (of no more than three), if you wish.<br />
Note: If you are relatively new to Stata, this could take some time. Please do not hesitate to write to us if you have questions.<br />
Module 2. Setting a <strong>Poverty</strong> Line<br />
The poor are those whose welfare falls below some poverty line. The construction of a poverty line is both<br />
somewhat arbitrary and potentially controversial. In this module we examine how poverty lines are, and perhaps<br />
should be, established.<br />
Learning objectives<br />
1. Explain what a poverty line is, why it is needed, and how countries adjust their poverty lines over time.<br />
2. Distinguish between absolute and relative poverty lines, and identify the conditions under which one might be preferred to the other.<br />
3. Identify the steps required to construct a poverty line using the Cost of Basic Needs method, and justify the choices made at each step.<br />
4. Show how to construct a poverty line using the Food Energy Intake method, and explain the serious weaknesses of this method.<br />
5. Explain how subjective poverty lines are constructed and appraise their usefulness.<br />
6. Construct a poverty line using real survey data, using<br />
a. The Cost of Basic Needs method.<br />
b. The Food Energy Intake method.<br />
Materials<br />
Reading: Handbook on <strong>Poverty</strong> and Inequality, chapter 3.<br />
Chapter 3 on <strong>Poverty</strong> Lines covers a lot of ground. Key points to note are: the cost of basic needs approach is<br />
conceptually attractive, but not used as widely as one might expect; the food energy intake is easy to apply<br />
<strong>Poverty</strong> & Inequality – Winter 2011 Syllabus Page 2 of 7
Quiz:<br />
Exercises:<br />
but flawed; and subjective measures of poverty are inexpensive to collect but difficult to interpret. Note the<br />
variety of poverty lines in Africa, as shown in Table 3.7.<br />
The article by Shaohua Chen and Martin Ravallion simulates the impact of the global financial crisis on the world’s<br />
poorest, and is highly recommended.<br />
Set yourself a goal of getting at least 10 of the 13 questions right on the chapter 3 quiz!<br />
Exercise 2 (which is an abridged version of Exercise 2 in Appendix 3 of the Handbook) should be completed and sent to<br />
me for feedback and comments. Again, you are welcome to work on this exercise in groups (of no more than three), if<br />
you wish.<br />
Module 3. Measures of <strong>Poverty</strong><br />
Given information on a welfare measure (such as expenditure per capita) and a poverty line, the third step is to<br />
summarize the information in the form of an index of poverty. In this module we review some of the more<br />
popular measures and ask how robust they are.<br />
Learning Objectives<br />
1) Describe and explain the headcount index, indicate why it is popular, and explain why it is an imperfect measure of poverty.<br />
2) Describe and compute the poverty gap and poverty severity indexes, and evaluate their adequacy as measures of poverty.<br />
3) Compute the Watts index.<br />
4) Argue that there is no single best measure of poverty.<br />
5) Explain what is meant by robustness and why poverty measures might not be robust.<br />
6) Describe sampling error, and argue the case for presenting standard deviations and confidence intervals along with poverty rates.<br />
7) Explain what bootstrapping is and how it may be used to generate confidence intervals and sample standard deviations.<br />
8) Enumerate the sources of measurement error.<br />
a) Define the elasticity of the headcount index with respect to errors in mean expenditure (or income) per capita, and explain how this<br />
translates an understatement of expenditure (or income) into an overstatement of poverty.<br />
9) Define, and show how to graph, the poverty incidence curve and the poverty deficit curve.<br />
10) Explain what is meant by first order stochastic dominance, and why it is useful when assessing how robust a poverty comparison is to the<br />
choice of poverty line or poverty measure.<br />
Materials<br />
Reading: Handbook on <strong>Poverty</strong> and Inequality, chapters 4, 5, and 16.<br />
Chapter 4 on Measures of <strong>Poverty</strong> sets out the traditional summary statistics, including the headcount and poverty gap indexes.<br />
Chapter 5 asks how robust the measures of poverty are, and introduces the concept of stochastic dominance. One<br />
needs to recognize the importance of sampling error, measurement error, and first-order stochastic dominance.<br />
If you have spare time (!), feel free to explore other measures of poverty, including the Sen-Shorrocks-Thon index (section 4.4 of<br />
chapter 4); and learn about broader measures of robustness, including higher-order stochastic dominance (parts of<br />
section 5.5 of chapter 5). Chapter 16 (Using Survey Data: Some Cautionary Tales) is easy to read and provides several<br />
examples of practical problems that arise in measuring poverty and making poverty comparisons.<br />
Quiz: The quiz covers materials from all the sections of chapters 4 and 5 recommended for this course. Make a habit of taking the quiz<br />
after completing the readings!<br />
Exercises: Exercise 3 (which is similar to Exercises 3 and 4 in Appendix III of the Handbook) should be completed and sent to me. You will<br />
probably need the weekend to finish these exercises (and catch up on any delays!).<br />
Module 4. Panel Data and <strong>Poverty</strong> Dynamics<br />
It is frequently useful to measure the evolution of poverty over time. This can be done with repeated crosssections<br />
or, usually more precisely, with panel data. Only panel data allow one to measure the extent to which<br />
households transition into and out of poverty. Although panel data are indispensable for measuring poverty<br />
transitions, and chronic poverty, there are significant costs to collecting and using panel data.<br />
Learning Objectives<br />
1. Explain the value of measuring the evolution of poverty over time (“poverty dynamics<br />
2. Describe the main sources of data on poverty dynamics, including panel data, repeated cross-sectional data, and data from rotating<br />
panels.<br />
3. Distinguish between panel data based on repeated surveying of households, dwellings, and individuals.<br />
4. Explain how to construct a transition matrix.<br />
5. Distinguish between the chronically poor, the persistently poor, and the transient poor, and explain the practical importance of these<br />
distinctions. Itemize the advantages of panel surveys, and explain how panel data can give more precise estimates of changes in poverty<br />
over time (compared to data from cross-sections).<br />
6. Summarize the drawbacks of panel surveys, including attrition bias, decreased representativeness, and high managerial demands.<br />
<strong>Poverty</strong> & Inequality – Winter 2011 Syllabus Page 3 of 7
Materials<br />
Reading: Handbook on <strong>Poverty</strong> and Inequality, chapter 7 (pages 127-129), and chapter 11.<br />
The short excerpt from chapter 7 puts the comparison of poverty over time in the context of constructing poverty profiles.<br />
Chapter 11 covers the essentials of panel data and the measurement of chronic poverty. The only way to measure<br />
chronic poverty, or to quantify transitions into and out of poverty, is with panel data. But such data have weaknesses<br />
too, including attrition bias and nonrepresentativeness.<br />
Quiz:<br />
Exercises:<br />
The reading from the Handbook is not technically too difficult, but quiz should help reinforce the material.<br />
Exercise 4 (which is similar to Exercise 9 in the Handbook) asks you to combine data from two years of a panel data set from<br />
Bangladesh and generate summary statistics, including information on attrition bias, as well as construct a transition matrix. As<br />
usual, please submit your assignment so that we can provide feedback on your work. Exercise 5 (which corresponds to Exercises<br />
10 and 11 in the Handbook) requires the measurement of chronic, persistent and transient poverty.<br />
Module 5. Growth and <strong>Poverty</strong><br />
Here we ask whether economic growth tends to help or hurt the poor, and what is meant by “pro-poor” growth.<br />
Learning Objectives<br />
1) Explain the methodology used by Dollar and Kraay to reach the conclusion that growth is good for the poor.<br />
2) Evaluate the role of other influences—including government spending, openness to trade, democracy, fiscal discipline, and the rule of<br />
law—on the growth of incomes, and of the incomes of the poor.<br />
3) Describe what is meant by “pro-poor growth.”<br />
4) For each of the three groups of antipoverty activities identified by the World Bank, that is,<br />
promoting opportunity<br />
facilitating empowerment, and<br />
enhancing income security,<br />
justify the importance of each broad activity and identify specific policies within each of these activities that are likely to work to reduce<br />
poverty.<br />
5) Explain how the 2008-09 worldwide recession affected poor countries and poor people, and how governments have responded,<br />
especially to cushion the effects on the poor.<br />
Materials<br />
Reading: Handbook on <strong>Poverty</strong> and Inequality, chapter 9.<br />
This chapter discusses the controversial Dollar and Kraay study on the link between growth and poverty, and sketches the outlines<br />
of the World Bank approach to tackling poverty.<br />
Quiz: A short multiple-choice quiz follows the reading.<br />
Exercises: Exercise 5 explores the links between the recent world recession and third-world poverty.<br />
Module 6. Analyzing <strong>Poverty</strong><br />
In this module we first review the essential features of regression analysis, and then apply these techniques to the<br />
analysis of the causes and effects of poverty. The module includes a discussion of impact evaluation, as well as<br />
most standard applications of econometric methods in the context of poverty.<br />
Learning Objectives<br />
1) Explain how to make relatively precise inferences about trends in poverty using panel data.<br />
2) Evaluate the impact of a project or policy by computing double differences.<br />
3) Estimate panel regressions, with and without instrumental variables, when undertaking impact evaluations.<br />
4) Quantify the effects of its immediate determinants on the level of poverty, and the effect of poverty on outcomes such as health and<br />
education.<br />
Materials<br />
Reading: Handbook on <strong>Poverty</strong> and Inequality, chapters 14 and 13 (pages 256-270).<br />
Chapter 14 sets out the essential of regression – an indispensible tool for poverty analysis – and summarizes the most frequentlyencountered<br />
problems when estimating regressions, along with possible solutions.<br />
Chapter 13 examines the methodological issues related to impact evaluation; this is an important subject, and an essential input<br />
into any cost-benefit analysis of schemes designed to reduce poverty.<br />
Quiz:<br />
Exercises:<br />
A ten-question multiple-choice quiz follows the reading.<br />
Exercise 6 (equivalent to Exercises 14 and 15 in the Handbook) sets up an impact evaluation and asks you to measure the effects<br />
using double differences, and with a panel regression. There is also a question that simply applies regression analysis to crosscountry<br />
data.<br />
<strong>Poverty</strong> & Inequality – Winter 2011 Syllabus Page 4 of 7
Module 7. International <strong>Poverty</strong> Comparisons over Time<br />
There is some controversy about the extent to which, or even whether, poverty has fallen worldwide over the past<br />
generation. In this model we review the World Bank approach to measuring the evolution of world poverty and<br />
evaluate the criticisms of this work. At a smaller scale, we examine the extent to which poverty rose in Indonesia<br />
after the Asian financial crisis of 1997, and find that estimates vary widely; the variation in the estimates is due<br />
largely to differences in the technical assumptions made by different teams of researchers.<br />
Learning Objectives<br />
1) Identify those parts of the world where poverty has fallen most quickly, and least quickly, since 1981, according to the World Bank.<br />
2) Summarize the methodology used by the World Bank to compute world poverty rates, and explain:<br />
the role played by the initial choice of poverty line<br />
the need to use purchasing power parity (PPP) exchange rates<br />
the use of domestic CPIs to adjust local-currency poverty lines to the survey year<br />
how the poverty rate and level is measured using a Lorenz curve and poverty line.<br />
3) Explain and evaluate the main elements of the criticisms of the World Bank approach to measuring world poverty.<br />
4) Explain the methodology used by Dollar and Kraay to reach the conclusion that growth is good for the poor<br />
5) Recognize that while economic growth drives poverty reduction in the long run, this need not be the case in the short run.<br />
6) Assess the extent to which poverty in Indonesia rose after the Asian financial crisis in 1997-98, and evaluate the choices made by<br />
different research teams in making such measurements.<br />
Materials<br />
Reading:<br />
Quiz:<br />
Exercises:<br />
Handbook on <strong>Poverty</strong> and Inequality, chapter 10 (International <strong>Poverty</strong> Comparisons) and chapter 11 (218-227) on “Case Study: The<br />
Asian Financial Crisis and <strong>Poverty</strong> in Indonesia.”<br />
The World Bank’s approach to measuring the evolution of poverty – applying the “$1.25-a-day” standard using purchasing power<br />
parity – is easy to criticize, but alternatives (such as a universally-applied cost of basic goods measure) have drawbacks<br />
too. Bhalla argues that survey data understate expenditure and so overstate poverty, but the adjustments he proposes<br />
are probably excessive; this is a debate that needs to be understood.<br />
The quiz covers the material in chapter 10. If you get at least 8 questions right, bravo!<br />
Exercise 7 (which is Exercise 8 in the Handbook) asks you to use the World Bank’s PovCalNet to trace poverty over time under<br />
alternative assumptions.<br />
Module 8. Vulnerability to <strong>Poverty</strong><br />
Learning Objectives<br />
1) Explain why measures of current poverty are inadequate as guides to anti-poverty policy.<br />
2) Define vulnerability to poverty.<br />
3) Explain how the measurement of vulnerability to poverty requires measures of<br />
Shocks to welfare;<br />
The socially-defined minimum level of wellbeing; and<br />
The propensity to suffer a significant shock of being poor.<br />
4) Describe how to measure vulnerability to poverty (v ht), given measures of expected consumption (E(c t+1)), its variance (σ 2 ), the poverty<br />
line (z) and a normality assumption.<br />
5) Outline the steps required to measure vulnerability to poverty, given data from a cross-sectional household survey.<br />
6) Summarize the methodological issues related to the practical measurement of vulnerability to poverty and how they might be resolved.<br />
7) Itemize the main sources of risk faced by households and the options they face in dealing with risk.<br />
Materials<br />
Reading:<br />
Quiz:<br />
Exercises:<br />
Handbook on <strong>Poverty</strong> and Inequality, chapter 12 (Vulnerability to <strong>Poverty</strong>).<br />
<strong>Poverty</strong> measures quantify those who are poor now; vulnerability measures try to determine who is likely to be poor<br />
next year, and in principle is the right measure to use in designing policy interventions. With strong<br />
assumptions vulnerability can be measured even using a single cross-section of data. The study of<br />
vulnerability to poverty leads to a richer menu of policy possibilities than does the traditional study of<br />
poverty, with greater emphasis on issues of insurance.<br />
Oxfam International has made some controversial proposals for delivering more resources to developing countries, “for<br />
nothing”. Read it, and formulate an opinion on the proposals!<br />
The quiz is relatively short; get them all right!<br />
Exercise 8 requires you to measure vulnerability using a cross section of data. Excellent practice!<br />
Module 9. Inequality<br />
<strong>Poverty</strong> & Inequality – Winter 2011 Syllabus Page 5 of 7
Learning Objectives<br />
1) Explain what inequality is and how it differs from poverty.<br />
2) Compute and display information on expenditure (or income) quintiles.<br />
3) Draw and interpret a Lorenz curve; and compute and explain the Gini coefficient of inequality.<br />
4) Argue that the Gini coefficient satisfies mean independence, population size independence, symmetry, and Pigou-Dalton Transfer<br />
sensitivity, but is not easily decomposable.<br />
5) Draw a Pen’s Parade for expenditure per capita, and explain why it is useful.<br />
6) Compute and interpret generalized entropy measures, including Theil’s T and Theil’s L.<br />
7) Compute and interpret Atkinson’s inequality measure for different values of the weighting parameter ε.<br />
8) Decompose inequality using Theil’s T to distinguish between-group from within-group components of inequality, for separate<br />
geographic areas and occupations.<br />
9) Identify the main sources of changes in inequality using Theil’s L.<br />
10) Explain how microsimulation techniques can be used to quantify the effect on income distribution of changes in prices, endowments,<br />
occupational choice, and demographics.<br />
Materials<br />
Reading: Handbook on <strong>Poverty</strong> and Inequality, chapter 6.<br />
Quiz: There are a number of interesting multiple choice questions for this module.<br />
Exercises: Exercise 9 asks you to measure inequality, given some primary (e.g. household survey) data.<br />
Module 10. The Incidence of Government Taxes and Spending<br />
Learning Objectives<br />
1) Explain the purpose of tax and expenditure incidence analysis.<br />
2) Define what is meant by a progressive tax, a proportional tax, and a regressive tax.<br />
3) Outline the steps required to measure the incidence of a tax.<br />
4) Compute the Kakwani measure of tax progressivity and the Reynolds-Smolensky measure of redistributive capacity, given information<br />
on tax incidence.<br />
5) Outline the steps required to measure the incidence of a government-provided good or service.<br />
6) Assess the limits of tax and expenditure incidence analysis, with particular attention to the role of the following: average vs. marginal<br />
incidence; the use of income vs. expenditure to order households; the role of behavioral responses; the valuation of the benefits of<br />
government spending; the merits of partial vs. full incidence; and the proper role for further modeling.<br />
7) Explain why public expenditure analysis is useful only if the policy setting is right.<br />
Materials<br />
Reading: Handbook on <strong>Poverty</strong> and Inequality, chapter 15.<br />
Quiz:<br />
Just a few last questions, and then you should know it all!<br />
Exercises:<br />
The exercise for this module asks you to measure and interpret the incidence of a set of tax and expenditure changes,<br />
using household survey data.<br />
Final Project:<br />
This will generally be a 20-slide PowerPoint presentation, where each member of a team of three will talk about some<br />
aspect of the subject. You may choose any relevant topic; it should involve some data work, using techniques from this<br />
course and/or techniques from the Data Mining course.<br />
The hardest part is identifying a topic; if it is something relevant that you are already working on, so much the better!<br />
Here are a few suggestions (but do not be constrained by these):<br />
The Effect of the Global Economic Crisis on <strong>Poverty</strong> in xxx (where xxx is a country of interest to you). You might<br />
identify the channels through which the effects of the crisis are being transmitted – e.g. remittances, aid, FDI,<br />
loans, migration, trade, commodity prices – and try to track the implications for poverty (and/or vulnerability).<br />
The Evolution of <strong>Poverty</strong> in xxx (where xxx is your chosen country). You could summarize what has happened to<br />
poverty in your country over the past decade, noting data sources, the definition of welfare that was used, how the<br />
poverty line was set, how robust the estimates are, and any other relevant issues.<br />
Chronic <strong>Poverty</strong> in xxx (where xxx is your chosen country). If you have panel data, it is possible to discuss chronic<br />
poverty – how it is defined and measured, how robust the measures are, how the information is influencing policy.<br />
Vulnerability to <strong>Poverty</strong> in xxx (where xxx is your chosen country). This would ideally include an estimate of<br />
vulnerability, which in turn will require access to the primary data. Vulnerability to <strong>Poverty</strong> is the topic of Module 8.<br />
Data Needs for Evaluating the Impact of a Project. This could refer to a specific project, or a category of projects.<br />
Among the issues to be addressed is whether panel data are needed; and if so, how large a sample.<br />
Use your imagination, experience, and talent!<br />
<strong>Poverty</strong> & Inequality – Winter 2011 Syllabus Page 6 of 7
Readings.<br />
Abou-Ali, Hala, Hesham El-Azony, Heba El-Laithy, Jonathan Haughton, and Shahidur R. Khandker. 2009.<br />
Evaluating the Impact of Egyptian Social Fund for Development Programs. Policy Research Working<br />
Paper 4993, World Bank, July 2009.<br />
http://econ.worldbank.org/external/default/mainpagePK=64165259&theSitePK=469372&piPK=64165421&menuPK=64166093&e<br />
ntityID=000158349_20090714144602<br />
Chen, Shaohua, and Martin Ravallion. 2009. The Impact of the Global Financial Crisis on the World’s Poorest.<br />
Unpublished.<br />
http://www.voxeu.org/index.phpq=node/3520<br />
Dollar, David, and Aart Kraay, “Growth is Good for the Poor,” 2002; may be downloaded via<br />
www.worldbank.org/research .<br />
Haughton, Jonathan, and Shahidur Khandker. 2009. Handbook on <strong>Poverty</strong> and Inequality, World Bank,<br />
Washington DC.<br />
http://econ.worldbank.org/external/default/mainpagePK=64165259&piPK=64165421&theSitePK=469382&menuPK=64216926&e<br />
ntityID=000333037_20090505014701<br />
Ravallion, Martin. 2008. Bailing out the World’s Poorest. Policy Research Working Paper 4763, World Bank,<br />
Washington DC.<br />
http://vanuatu2010.un.org.fj/resources/uploads/attachments/documents/Bailing_out_the_world_s_poorest.pdf<br />
Ravallion, Martin. 2010. “The Crisis and the World’s Poorest.” Development Outreach, World Bank Institute,<br />
Washington DC.<br />
http://siteresources.worldbank.org/WBI/Resources/213798-1259968479602/outreach_ravallion_dec09.pdf<br />
Loan, Le Thi Thanh, et al. 2010. Urban <strong>Poverty</strong> Assessment in Hanoi and Ho Chi Minh City: Executive Summary.<br />
For UNDP, Hanoi People’s Committee, and Ho Chi Minh City People’s Committee.<br />
http://mail.beaconhill.org/~j_haughton<br />
<strong>Poverty</strong> & Inequality – Winter 2011 Syllabus Page 7 of 7


