BLM WY Golden Eagle Research and Monitoring - Buffalo Bill ...
BLM WY Golden Eagle Research and Monitoring - Buffalo Bill ...
BLM WY Golden Eagle Research and Monitoring - Buffalo Bill ...

You also want an ePaper? Increase the reach of your titles
YUMPU automatically turns print PDFs into web optimized ePapers that Google loves.
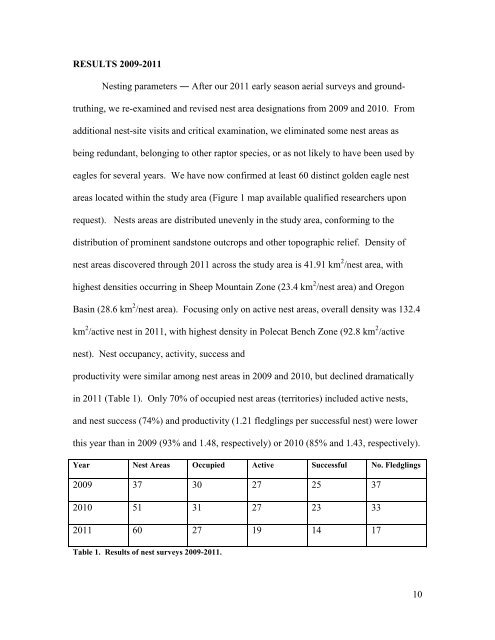
RESULTS 2009-2011<br />
Nesting parameters ― After our 2011 early season aerial surveys <strong>and</strong> groundtruthing,<br />
we re-examined <strong>and</strong> revised nest area designations from 2009 <strong>and</strong> 2010. From<br />
additional nest-site visits <strong>and</strong> critical examination, we eliminated some nest areas as<br />
being redundant, belonging to other raptor species, or as not likely to have been used by<br />
eagles for several years. We have now confirmed at least 60 distinct golden eagle nest<br />
areas located within the study area (Figure 1 map available qualified researchers upon<br />
request). Nests areas are distributed unevenly in the study area, conforming to the<br />
distribution of prominent s<strong>and</strong>stone outcrops <strong>and</strong> other topographic relief. Density of<br />
nest areas discovered through 2011 across the study area is 41.91 km 2 /nest area, with<br />
highest densities occurring in Sheep Mountain Zone (23.4 km 2 /nest area) <strong>and</strong> Oregon<br />
Basin (28.6 km 2 /nest area). Focusing only on active nest areas, overall density was 132.4<br />
km 2 /active nest in 2011, with highest density in Polecat Bench Zone (92.8 km 2 /active<br />
nest). Nest occupancy, activity, success <strong>and</strong><br />
productivity were similar among nest areas in 2009 <strong>and</strong> 2010, but declined dramatically<br />
in 2011 (Table 1). Only 70% of occupied nest areas (territories) included active nests,<br />
<strong>and</strong> nest success (74%) <strong>and</strong> productivity (1.21 fledglings per successful nest) were lower<br />
this year than in 2009 (93% <strong>and</strong> 1.48, respectively) or 2010 (85% <strong>and</strong> 1.43, respectively).<br />
Year Nest Areas Occupied Active Successful No. Fledglings<br />
2009 37 30 27 25 37<br />
2010 51 31 27 23 33<br />
2011 60 27 19 14 17<br />
Table 1. Results of nest surveys 2009-2011.<br />
10