COINTEGRATION - IASRI
COINTEGRATION - IASRI
COINTEGRATION - IASRI
Create successful ePaper yourself
Turn your PDF publications into a flip-book with our unique Google optimized e-Paper software.
Cointegration<br />
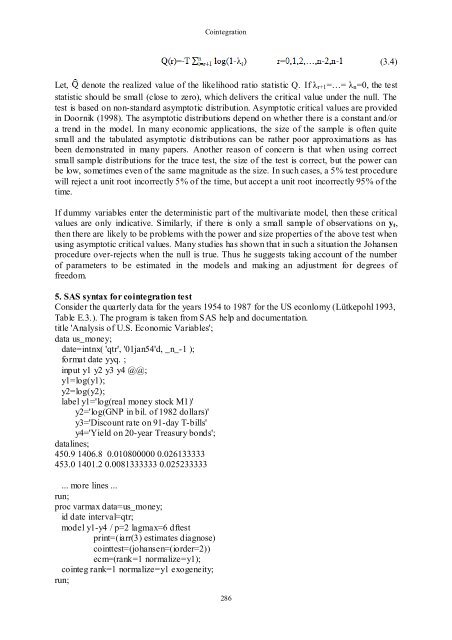
Let, denote the realized value of the likelihood ratio statistic Q. If λ r+1 =…= λ n =0, the test<br />
statistic should be small (close to zero), which delivers the critical value under the null. The<br />
test is based on non-standard asymptotic distribution. Asymptotic critical values are provided<br />
in Doornik (1998). The asymptotic distributions depend on whether there is a constant and/or<br />
a trend in the model. In many economic applications, the size of the sample is often quite<br />
small and the tabulated asymptotic distributions can be rather poor approximations as has<br />
been demonstrated in many papers. Another reason of concern is that when using correct<br />
small sample distributions for the trace test, the size of the test is correct, but the power can<br />
be low, sometimes even of the same magnitude as the size. In such cases, a 5% test procedure<br />
will reject a unit root incorrectly 5% of the time, but accept a unit root incorrectly 95% of the<br />
time.<br />
If dummy variables enter the deterministic part of the multivariate model, then these critical<br />
values are only indicative. Similarly, if there is only a small sample of observations on y t ,<br />
then there are likely to be problems with the power and size properties of the above test when<br />
using asymptotic critical values. Many studies has shown that in such a situation the Johansen<br />
procedure over-rejects when the null is true. Thus he suggests taking account of the number<br />
of parameters to be estimated in the models and making an adjustment for degrees of<br />
freedom.<br />
5. SAS syntax for cointegration test<br />
Consider the quarterly data for the years 1954 to 1987 for the US econlomy (Lütkepohl 1993,<br />
Table E.3.). The program is taken from SAS help and documentation.<br />
title 'Analysis of U.S. Economic Variables';<br />
data us_money;<br />
date=intnx( 'qtr', '01jan54'd, _n_-1 );<br />
format date yyq. ;<br />
input y1 y2 y3 y4 @@;<br />
y1=log(y1);<br />
y2=log(y2);<br />
label y1='log(real money stock M1)'<br />
y2='log(GNP in bil. of 1982 dollars)'<br />
y3='Discount rate on 91-day T-bills'<br />
y4='Yield on 20-year Treasury bonds';<br />
datalines;<br />
450.9 1406.8 0.010800000 0.026133333<br />
453.0 1401.2 0.0081333333 0.025233333<br />
... more lines ...<br />
run;<br />
proc varmax data=us_money;<br />
id date interval=qtr;<br />
model y1-y4 / p=2 lagmax=6 dftest<br />
print=(iarr(3) estimates diagnose)<br />
cointtest=(johansen=(iorder=2))<br />
ecm=(rank=1 normalize=y1);<br />
cointeg rank=1 normalize=y1 exogeneity;<br />
run;<br />
286<br />
(3.4)


