
You also want an ePaper? Increase the reach of your titles
YUMPU automatically turns print PDFs into web optimized ePapers that Google loves.
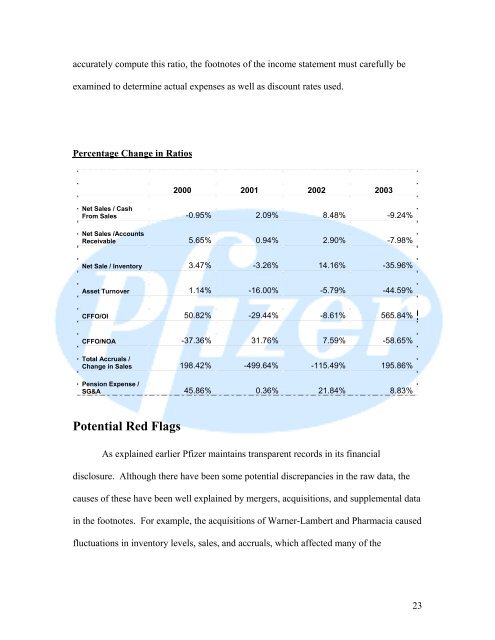
accurately compute this ratio, the footnotes of the income statement must carefully be<br />
examined to determine actual expenses as well as discount rates used.<br />
Percentage Change in Ratios<br />
2000 2001 2002 2003<br />
Net Sales / Cash<br />
From Sales -0.95% 2.09% 8.48% -9.24%<br />
Net Sales /Accounts<br />
Receivable 5.65% 0.94% 2.90% -7.98%<br />
Net Sale / Inventory 3.47% -3.26% 14.16% -35.96%<br />
Asset Turnover 1.14% -16.00% -5.79% -44.59%<br />
CFFO/OI 50.82% -29.44% -8.61% 565.84%<br />
CFFO/NOA -37.36% 31.76% 7.59% -58.65%<br />
Total Accruals /<br />
Change in Sales 198.42% -499.64% -115.49% 195.86%<br />
Pension Expense /<br />
SG&A 45.86% 0.36% 21.84% 8.83%<br />
Potential Red Flags<br />
As explained earlier <strong>Pfizer</strong> maintains transparent records in its financial<br />
disclosure. Although there have been some potential discrepancies in the raw data, the<br />
causes of these have been well explained by mergers, acquisitions, and supplemental data<br />
in the footnotes. For example, the acquisitions of Warner-Lambert and Pharmacia caused<br />
fluctuations in inventory levels, sales, and accruals, which affected many of the<br />
23