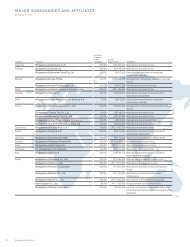
Financial Review 2010 - Bridgestone EUROPE
Financial Review 2010 - Bridgestone EUROPE
Financial Review 2010 - Bridgestone EUROPE

You also want an ePaper? Increase the reach of your titles
YUMPU automatically turns print PDFs into web optimized ePapers that Google loves.
Management’s<br />
discussion<br />
& analysis<br />
Unless otherwise noted, all figures are taken from the<br />
consolidated financial statements and notes. The U.S. dollar<br />
figures have been translated solely for the convenience of<br />
readers outside Japan at ¥81.49 to $1, the prevailing exchange<br />
rate on December 31, <strong>2010</strong>. <strong>Financial</strong> disclosures by the<br />
<strong>Bridgestone</strong> Corporation (“the Company”) are in accordance<br />
with accounting principles generally accepted in Japan.<br />
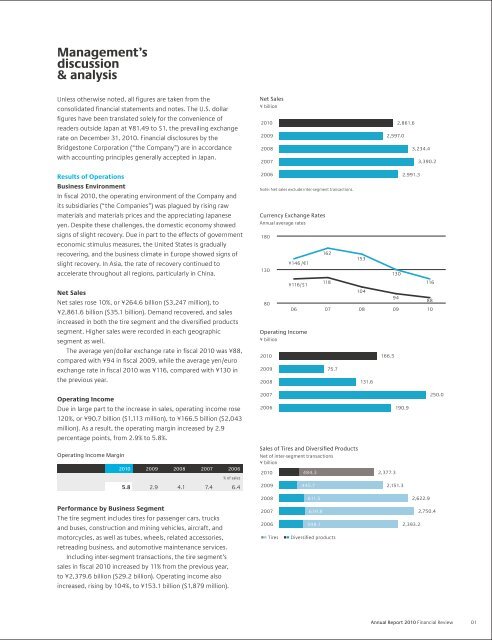
Net Sales<br />
¥ billion<br />
<strong>2010</strong><br />
2009<br />
2008<br />
2007<br />
2,861.6<br />
2,597.0<br />
3,234.4<br />
3,390.2<br />
Results of Operations<br />
Business Environment<br />
In fiscal <strong>2010</strong>, the operating environment of the Company and<br />
its subsidiaries (“the Companies”) was plagued by rising raw<br />
materials and materials prices and the appreciating Japanese<br />
yen. Despite these challenges, the domestic economy showed<br />
signs of slight recovery. Due in part to the effects of government<br />
economic stimulus measures, the United States is gradually<br />
recovering, and the business climate in Europe showed signs of<br />
slight recovery. In Asia, the rate of recovery continued to<br />
accelerate throughout all regions, particularly in China.<br />
Net Sales<br />
Net sales rose 10%, or ¥264.6 billion ($3,247 million), to<br />
¥2,861.6 billion ($35.1 billion). Demand recovered, and sales<br />
increased in both the tire segment and the diversified products<br />
segment. Higher sales were recorded in each geographic<br />
segment as well.<br />
The average yen/dollar exchange rate in fiscal <strong>2010</strong> was ¥88,<br />
compared with ¥94 in fiscal 2009, while the average yen/euro<br />
exchange rate in fiscal <strong>2010</strong> was ¥116, compared with ¥130 in<br />
the previous year.<br />
2006<br />
Note: Net sales exclude inter-segment transactions.<br />
Currency Exchange Rates<br />
Annual average rates<br />
180<br />
130<br />
80<br />
<strong>2010</strong><br />
2009<br />
2008<br />
¥146/€1<br />
¥116/$1<br />
Operating Income<br />
¥ billion<br />
162<br />
118<br />
153<br />
104<br />
130<br />
94<br />
2,991.3<br />
06 07 08 09 10<br />
75X30<br />
75.7<br />
131.6<br />
166.5<br />
116<br />
88<br />
Operating Income<br />
Due in large part to the increase in sales, operating income rose<br />
120%, or ¥90.7 billion ($1,113 million), to ¥166.5 billion ($2,043<br />
million). As a result, the operating margin increased by 2.9<br />
percentage points, from 2.9% to 5.8%.<br />
2007<br />
2006<br />
190.9<br />
250.0<br />
Operating Income Margin<br />
<strong>2010</strong> 2009 2008 2007 2006<br />
% of sales<br />
Sales of Tires and Diversified Products<br />
Net of inter-segment transactions<br />
¥ billion<br />
<strong>2010</strong><br />
484.3<br />
2,377.3<br />
5.8 2.9 4.1 7.4 6.4<br />
2009<br />
445.7<br />
2,151.3<br />
2008<br />
611.5<br />
2,622.9<br />
Performance by Business Segment<br />
The tire segment includes tires for passenger cars, trucks<br />
and buses, construction and mining vehicles, aircraft, and<br />
motorcycles, as well as tubes, wheels, related accessories,<br />
retreading business, and automotive maintenance services.<br />
Including inter-segment transactions, the tire segment’s<br />
sales in fiscal <strong>2010</strong> increased by 11% from the previous year,<br />
to ¥2,379.6 billion ($29.2 billion). Operating income also<br />
increased, rising by 104%, to ¥153.1 billion ($1,879 million).<br />
2007<br />
2006<br />
Tires<br />
639.8<br />
598.1<br />
Diversified products<br />
2,393.2<br />
2,750.4<br />
Annual Report <strong>2010</strong> <strong>Financial</strong> <strong>Review</strong><br />
01