Forecasting Accuracy - ACT Budget.pdf - Treasury
Forecasting Accuracy - ACT Budget.pdf - Treasury
Forecasting Accuracy - ACT Budget.pdf - Treasury
You also want an ePaper? Increase the reach of your titles
YUMPU automatically turns print PDFs into web optimized ePapers that Google loves.
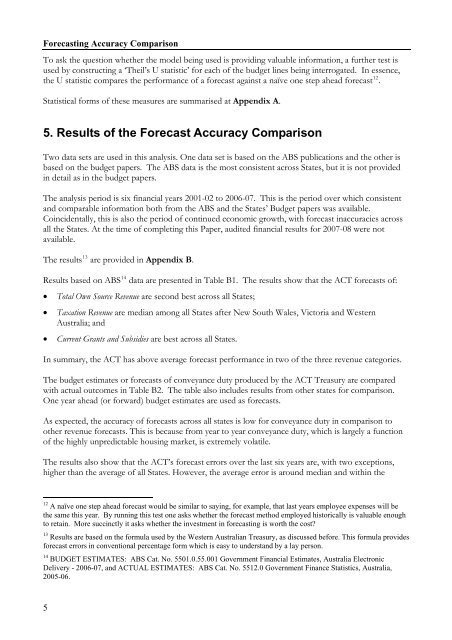
<strong>Forecasting</strong> <strong>Accuracy</strong> Comparison<br />
To ask the question whether the model being used is providing valuable information, a further test is<br />
used by constructing a ‘Theil’s U statistic’ for each of the budget lines being interrogated. In essence,<br />
the U statistic compares the performance of a forecast against a naïve one step ahead forecast 12 .<br />
Statistical forms of these measures are summarised at Appendix A.<br />
5. Results of the Forecast <strong>Accuracy</strong> Comparison<br />
Two data sets are used in this analysis. One data set is based on the ABS publications and the other is<br />
based on the budget papers. The ABS data is the most consistent across States, but it is not provided<br />
in detail as in the budget papers.<br />
The analysis period is six financial years 2001-02 to 2006-07. This is the period over which consistent<br />
and comparable information both from the ABS and the States’ <strong>Budget</strong> papers was available.<br />
Coincidentally, this is also the period of continued economic growth, with forecast inaccuracies across<br />
all the States. At the time of completing this Paper, audited financial results for 2007-08 were not<br />
available.<br />
The results 13 are provided in Appendix B.<br />
Results based on ABS 14 data are presented in Table B1. The results show that the <strong>ACT</strong> forecasts of:<br />
• Total Own Source Revenue are second best across all States;<br />
• Taxation Revenue are median among all States after New South Wales, Victoria and Western<br />
Australia; and<br />
• Current Grants and Subsidies are best across all States.<br />
In summary, the <strong>ACT</strong> has above average forecast performance in two of the three revenue categories.<br />
The budget estimates or forecasts of conveyance duty produced by the <strong>ACT</strong> <strong>Treasury</strong> are compared<br />
with actual outcomes in Table B2. The table also includes results from other states for comparison.<br />
One year ahead (or forward) budget estimates are used as forecasts.<br />
As expected, the accuracy of forecasts across all states is low for conveyance duty in comparison to<br />
other revenue forecasts. This is because from year to year conveyance duty, which is largely a function<br />
of the highly unpredictable housing market, is extremely volatile.<br />
The results also show that the <strong>ACT</strong>’s forecast errors over the last six years are, with two exceptions,<br />
higher than the average of all States. However, the average error is around median and within the<br />
12 A naïve one step ahead forecast would be similar to saying, for example, that last years employee expenses will be<br />
the same this year. By running this test one asks whether the forecast method employed historically is valuable enough<br />
to retain. More succinctly it asks whether the investment in forecasting is worth the cost<br />
13 Results are based on the formula used by the Western Australian <strong>Treasury</strong>, as discussed before. This formula provides<br />
forecast errors in conventional percentage form which is easy to understand by a lay person.<br />
14 BUDGET ESTIMATES: ABS Cat. No. 5501.0.55.001 Government Financial Estimates, Australia Electronic<br />
Delivery - 2006-07, and <strong>ACT</strong>UAL ESTIMATES: ABS Cat. No. 5512.0 Government Finance Statistics, Australia,<br />
2005-06.<br />
5


