Term Contributed Boundary Feature using ... - Academia Sinica
Term Contributed Boundary Feature using ... - Academia Sinica
Term Contributed Boundary Feature using ... - Academia Sinica

Create successful ePaper yourself
Turn your PDF publications into a flip-book with our unique Google optimized e-Paper software.
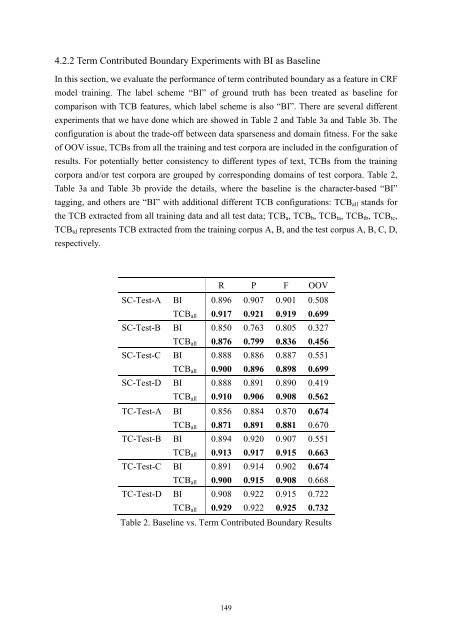
4.2.2 <strong>Term</strong> <strong>Contributed</strong> <strong>Boundary</strong> Experiments with BI as Baseline<br />
In this section, we evaluate the performance of term contributed boundary as a feature in CRF<br />
model training. The label scheme “BI” of ground truth has been treated as baseline for<br />
comparison with TCB features, which label scheme is also “BI”. There are several different<br />
experiments that we have done which are showed in Table 2 and Table 3a and Table 3b. The<br />
configuration is about the trade-off between data sparseness and domain fitness. For the sake<br />
of OOV issue, TCBs from all the training and test corpora are included in the configuration of<br />
results. For potentially better consistency to different types of text, TCBs from the training<br />
corpora and/or test corpora are grouped by corresponding domains of test corpora. Table 2,<br />
Table 3a and Table 3b provide the details, where the baseline is the character-based “BI”<br />
tagging, and others are “BI” with additional different TCB configurations: TCB all stands for<br />
the TCB extracted from all training data and all test data; TCB a , TCB b , TCB ta , TCB tb , TCB tc ,<br />
TCB td represents TCB extracted from the training corpus A, B, and the test corpus A, B, C, D,<br />
respectively.<br />
R P F OOV<br />
SC-Test-A BI 0.896 0.907 0.901 0.508<br />
TCB all 0.917 0.921 0.919 0.699<br />
SC-Test-B BI 0.850 0.763 0.805 0.327<br />
TCB all 0.876 0.799 0.836 0.456<br />
SC-Test-C BI 0.888 0.886 0.887 0.551<br />
TCB all 0.900 0.896 0.898 0.699<br />
SC-Test-D BI 0.888 0.891 0.890 0.419<br />
TCB all 0.910 0.906 0.908 0.562<br />
TC-Test-A BI 0.856 0.884 0.870 0.674<br />
TCB all 0.871 0.891 0.881 0.670<br />
TC-Test-B BI 0.894 0.920 0.907 0.551<br />
TCB all 0.913 0.917 0.915 0.663<br />
TC-Test-C BI 0.891 0.914 0.902 0.674<br />
TCB all 0.900 0.915 0.908 0.668<br />
TC-Test-D BI 0.908 0.922 0.915 0.722<br />
TCB all 0.929 0.922 0.925 0.732<br />
Table 2. Baseline vs. <strong>Term</strong> <strong>Contributed</strong> <strong>Boundary</strong> Results