

PDF: 1115 KB - Bureau of Infrastructure, Transport and Regional ...
PDF: 1115 KB - Bureau of Infrastructure, Transport and Regional ...
PDF: 1115 KB - Bureau of Infrastructure, Transport and Regional ...

You also want an ePaper? Increase the reach of your titles
YUMPU automatically turns print PDFs into web optimized ePapers that Google loves.
8<br />
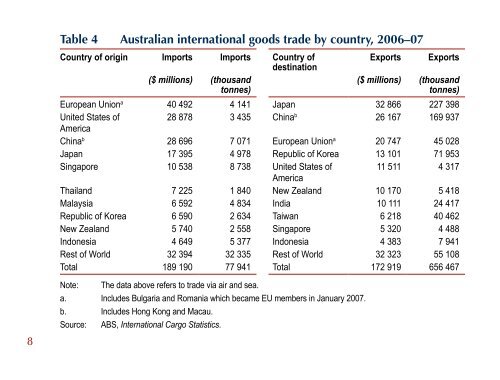
Table 4 Australian international goods trade by country, 2006–07<br />
Country <strong>of</strong> origin Imports Imports Country <strong>of</strong><br />
Exports Exports<br />
destination<br />
($ millions) (thous<strong>and</strong><br />
tonnes)<br />
($ millions) (thous<strong>and</strong><br />
tonnes)<br />
European Union a 40 492 4 141 Japan 32 866 227 398<br />
United States <strong>of</strong><br />
28 878 3 435 China b 26 167 169 937<br />
America<br />
China b 28 696 7 071 European Union a 20 747 45 028<br />
Japan 17 395 4 978 Republic <strong>of</strong> Korea 13 101 71 953<br />
Singapore 10 538 8 738 United States <strong>of</strong><br />
11 511 4 317<br />
America<br />
Thail<strong>and</strong> 7 225 1 840 New Zeal<strong>and</strong> 10 170 5 418<br />
Malaysia 6 592 4 834 India 10 111 24 417<br />
Republic <strong>of</strong> Korea 6 590 2 634 Taiwan 6 218 40 462<br />
New Zeal<strong>and</strong> 5 740 2 558 Singapore 5 320 4 488<br />
Indonesia 4 649 5 377 Indonesia 4 383 7 941<br />
Rest <strong>of</strong> World 32 394 32 335 Rest <strong>of</strong> World 32 323 55 108<br />
Total 189 190 77 941 Total 172 919 656 467<br />
Note: The data above refers to trade via air <strong>and</strong> sea.<br />
a. Includes Bulgaria <strong>and</strong> Romania which became EU members in January 2007.<br />
b. Includes Hong Kong <strong>and</strong> Macau.<br />
Source: ABS, International Cargo Statistics.


