Probabilistic Analysis of Deep Excavation Design and Construction ...
Probabilistic Analysis of Deep Excavation Design and Construction ...
Probabilistic Analysis of Deep Excavation Design and Construction ...

Create successful ePaper yourself
Turn your PDF publications into a flip-book with our unique Google optimized e-Paper software.
30<br />
Z.H. Dahri et al<br />
The study employed daily record <strong>of</strong><br />
snowcover which show that snowfall can take<br />
place during eight months (September–April)<br />
<strong>and</strong> even minute amounts can be observed<br />
during the four main summer months. Therefore,<br />
relating winter snowcover with total summer<br />
run<strong>of</strong>f volume may give reasonable estimates for<br />
only the four main summer months (May–<br />
August). Instead this study not only relates the<br />
daily river discharges with the daily snow area<br />
extent but also develops prediction model for the<br />
total run<strong>of</strong>f volume <strong>of</strong> the four main summer<br />
months. The study also relates the simulated<br />
snowmelt run<strong>of</strong>f (excluding rainfall run<strong>of</strong>f<br />
component) with the snow area extent.<br />
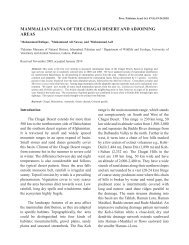
Fig. 10 clearly indicates a definite response<br />
<strong>of</strong> observed river discharges <strong>and</strong> simulated<br />
snowmelt run<strong>of</strong>f to seasonal snow cover<br />
changes, i.e. an increasing discharge associated<br />
with a decrease <strong>of</strong> snow area extent during the<br />
early summer (March-June), <strong>and</strong> decrease in<br />
discharge with decreasing snowcover in the late<br />
summer, monsoon season (July–August).<br />
Accordingly, two prediction models, described<br />
below, are developed to relate snowcover with<br />
river <strong>and</strong> snowmelt discharge.<br />
Fig. 10(a) relates snow cover with river <strong>and</strong><br />
snowmelt discharges for the early summer<br />
snowmelt season (March-June). This<br />
relationship can be described by the negative<br />
linear regression model as the river discharge<br />
increases with decrease in corresponding<br />
snowcover. Its relationship with the daily<br />
simulated snowmelt run<strong>of</strong>f is also negative but<br />
slightly different <strong>and</strong> is best explained by the<br />
third order polynomial function. This difference<br />
between the two regression models is due to<br />
variation <strong>of</strong> rainfall run<strong>of</strong>f component in the<br />
river discharges. Moreover, this inverse<br />
relationship is only true for the first part <strong>of</strong> the<br />
snowmelt season during which availability <strong>of</strong><br />
snowcover is generally not a limiting factor <strong>and</strong><br />
snowmelt run<strong>of</strong>f is largely the function <strong>of</strong><br />
available temperature. But as the melting season<br />
progresses, the available snowcover gets<br />
depleted <strong>and</strong> it starts limiting the snowmelt<br />
run<strong>of</strong>f more than the temperature. Relationship<br />
between snowcover, snowmelt run<strong>of</strong>f <strong>and</strong> river<br />
discharge during the second part <strong>of</strong> the snowmelt<br />
season (July–August) as in Fig. 10(b) is<br />
completely different from that <strong>of</strong> the first part.<br />
During this summer monsoon period, most <strong>of</strong><br />
seasonal snowcover at lower to medium<br />
elevations is melted <strong>and</strong> snowmelt run<strong>of</strong>f mainly<br />
comes from snowcover at high altitudes <strong>and</strong><br />
permanent snow <strong>and</strong> glaciers <strong>of</strong> higher<br />
elevations. Unlike the previous model, this<br />
regression model shows positive relationship <strong>of</strong><br />
average daily snowcover with the two run<strong>of</strong>fs.<br />
Also, there is exchange in type <strong>of</strong> regression<br />
model between the two relationships. The<br />
average daily snowcover now relates the<br />
simulated snowmelt run<strong>of</strong>f linearly, whereas its<br />
relationship with the average daily observed<br />
river discharge can be simplified by the second<br />
order polynomial function. The river discharge<br />
during the early July month tends to remain<br />
constant but greater river discharges in mid or<br />
late July than the early July month are due to<br />
greater contribution <strong>of</strong> rainfall run<strong>of</strong>f component<br />
during that period, otherwise snowmelt run<strong>of</strong>f<br />
decreases linearly during the following period.<br />
Average Daily Discharge (Cumec)<br />
River Discharge Snowmelt Run<strong>of</strong>f<br />
600<br />
y = -9.2607x + 558.38<br />
500<br />
R 2 = 0.9507<br />
400<br />
y = -0.0022x 3 + 0.3374x 2 - 23.303x + 628.54<br />
R 2 = 0.9522<br />
300<br />
200<br />
100<br />
0<br />
0 10 20 30 40 50 60<br />
Average Daily Snowcover (% <strong>of</strong> Basin Area)<br />
Average Daily Discharge(Cumec)<br />
River Discharge Snowmelt Run<strong>of</strong>f<br />
600<br />
500<br />
400<br />
y = -14.331x 2 + 210.35x - 276.33<br />
R 2 = 0.8785<br />
300<br />
200<br />
y = 65.898x - 99.637<br />
R 2 = 0.9489<br />
100<br />
0<br />
0 2 4 6 8 10<br />
Average Daily Snowcover (% <strong>of</strong> Basin Area)<br />
Fig. 10 (a) Relationship <strong>of</strong> daily snowcover<br />
with simulated snowmelt run<strong>of</strong>f <strong>and</strong> observed<br />
run<strong>of</strong>f for March–June months.<br />
Fig. 10 (b) Relationship <strong>of</strong> daily snowcover with<br />
simulated snowmelt run<strong>of</strong>f <strong>and</strong> observed run<strong>of</strong>f<br />
for July–August months.