Guidelines for Rolling in Cricket - Ecb - England and Wales Cricket ...
Guidelines for Rolling in Cricket - Ecb - England and Wales Cricket ...
Guidelines for Rolling in Cricket - Ecb - England and Wales Cricket ...

Create successful ePaper yourself
Turn your PDF publications into a flip-book with our unique Google optimized e-Paper software.
Centre <strong>for</strong> Sports Surface Technology<br />
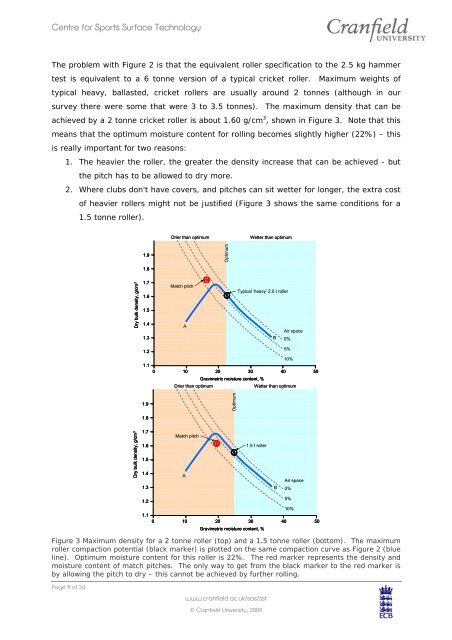
The problem with Figure 2 is that the equivalent roller specification to the 2.5 kg hammer<br />
test is equivalent to a 6 tonne version of a typical cricket roller. Maximum weights of<br />
typical heavy, ballasted, cricket rollers are usually around 2 tonnes (although <strong>in</strong> our<br />
survey there were some that were 3 to 3.5 tonnes). The maximum density that can be<br />
achieved by a 2 tonne cricket roller is about 1.60 g/cm 3 , shown <strong>in</strong> Figure 3. Note that this<br />
means that the optimum moisture content <strong>for</strong> roll<strong>in</strong>g becomes slightly higher (22%) – this<br />
is really important <strong>for</strong> two reasons:<br />
1. The heavier the roller, the greater the density <strong>in</strong>crease that can be achieved - but<br />
the pitch has to be allowed to dry more.<br />
2. Where clubs don't have covers, <strong>and</strong> pitches can sit wetter <strong>for</strong> longer, the extra cost<br />
of heavier rollers might not be justified (Figure 3 shows the same conditions <strong>for</strong> a<br />
1.5 tonne roller).<br />
Drier than optimum<br />
Wetter than optimum<br />
1.9<br />
Optimum<br />
1.8<br />
Dry bulk density, g/cm 3<br />
1.7<br />
1.6<br />
1.5<br />
1.4<br />
1.3<br />
Match pitch<br />
A<br />
Typical ‘heavy’ 2.0 t roller<br />
Air space<br />
B<br />
0%<br />
1.2<br />
1.1<br />
5%<br />
10%<br />
0 10 20 30 40 50<br />
Gravimetric moisture content, %<br />
Drier than optimum<br />
Wetter than optimum<br />
1.9<br />
Optimum<br />
1.8<br />
Dry bulk density, g/cm 3<br />
1.7<br />
1.6<br />
1.5<br />
1.4<br />
1.3<br />
Match pitch<br />
A<br />
1.5 t roller<br />
B<br />
Air space<br />
0%<br />
1.2<br />
1.1<br />
5%<br />
10%<br />
0 10 20 30 40 50<br />
Gravimetric moisture content, %<br />
Figure 3 Maximum density <strong>for</strong> a 2 tonne roller (top) <strong>and</strong> a 1.5 tonne roller (bottom). The maximum<br />
roller compaction potential (black marker) is plotted on the same compaction curve as Figure 2 (blue<br />
l<strong>in</strong>e). Optimum moisture content <strong>for</strong> this roller is 22%. The red marker represents the density <strong>and</strong><br />
moisture content of match pitches. The only way to get from the black marker to the red marker is<br />
by allow<strong>in</strong>g the pitch to dry – this cannot be achieved by further roll<strong>in</strong>g.<br />
Page 9 of 34<br />
www.cranfield.ac.uk/sas/sst<br />
© Cranfield University, 2009


![Indoor Sports Halls with Cricket Provision [TS3] - Ecb - England and ...](https://img.yumpu.com/49070696/1/190x135/indoor-sports-halls-with-cricket-provision-ts3-ecb-england-and-.jpg?quality=85)