South Dakota 24/7 Sobriety Program Evaluation Findings Report
South Dakota 24/7 Sobriety Program Evaluation Findings Report
South Dakota 24/7 Sobriety Program Evaluation Findings Report

Create successful ePaper yourself
Turn your PDF publications into a flip-book with our unique Google optimized e-Paper software.
Days of Testing<br />
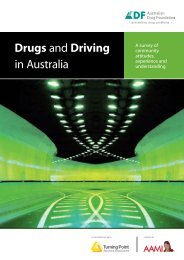
The following bar graph notes the frequency distribution of the length of time<br />
participants in the sample spent on the program calculated from the first test date to the<br />
last test date. The largest percentages participated in the program for a period of 31-60<br />
days (n = 982) and 91-180 days (n = 963).<br />
Figure 7: Number of Days from First Test Date to Last Test Date (n = 4,009)<br />
1200<br />
1000<br />
982<br />
963<br />
Number of Participants<br />
800<br />
600<br />
400<br />
232<br />
299<br />
385<br />
520<br />
<strong>24</strong>3<br />
200<br />
183 174<br />
28<br />
0<br />
0‐7 8‐14 15‐21 22‐30 31‐60 61‐90 91‐180 181‐365 366‐730 731+<br />
Number of Days<br />
Table 5: Number of Days from First Test Date to last Test Date (n = 4,009)<br />
First Test Date to<br />
Last Test Date n %<br />
Cumulative<br />
%<br />
0‐7 days 232 5.8% 5.8%<br />
8‐14 days 183 4.6% 10.4%<br />
15‐21 days 174 4.3% 14.7%<br />
22‐30 days 299 7.5% 22.2%<br />
31‐60 days 982 <strong>24</strong>.5% 46.6%<br />
61‐90 days 385 9.6% 56.2%<br />
91‐180 days 963 <strong>24</strong>.0% 80.3%<br />
181‐365 days 520 13.0% 93.2%<br />
366‐730 days <strong>24</strong>3 6.1% 99.3%<br />
731+ days 28 0.7% 100.0%<br />
Total 4,009 100%<br />
<strong>South</strong> <strong>Dakota</strong> <strong>24</strong>/7 <strong>Sobriety</strong> <strong>Program</strong> <strong>Evaluation</strong> <strong>Report</strong> 10