Flusberg BA, Nimmerjahn A, Cocker ED, Mukamel EA, Barretto RP ...
Flusberg BA, Nimmerjahn A, Cocker ED, Mukamel EA, Barretto RP ...
Flusberg BA, Nimmerjahn A, Cocker ED, Mukamel EA, Barretto RP ...

You also want an ePaper? Increase the reach of your titles
YUMPU automatically turns print PDFs into web optimized ePapers that Google loves.
BRIEF COMMUNICATIONS<br />
© 2008 Nature Publishing Group h ttp://www.nature.com/natur e method s<br />
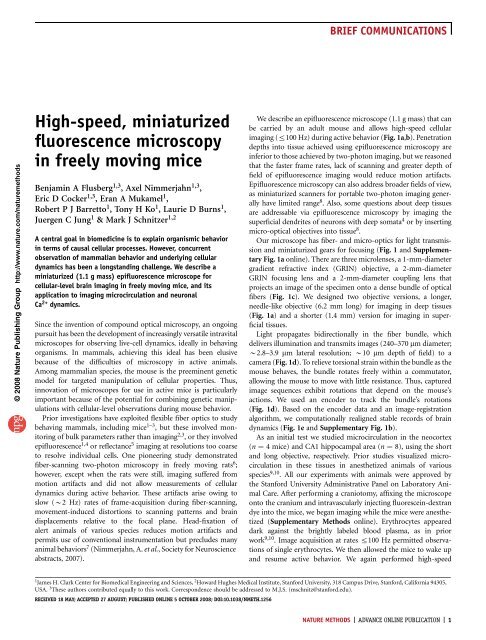
High-speed, miniaturized<br />
fluorescence microscopy<br />
in freely moving mice<br />
Benjamin A <strong>Flusberg</strong> 1,3 , Axel <strong>Nimmerjahn</strong> 1,3 ,<br />
Eric D <strong>Cocker</strong> 1,3 , Eran A <strong>Mukamel</strong> 1 ,<br />
Robert P J <strong>Barretto</strong> 1 ,TonyHKo 1 , Laurie D Burns 1 ,<br />
Juergen C Jung 1 & Mark J Schnitzer 1,2<br />
A central goal in biomedicine is to explain organismic behavior<br />
in terms of causal cellular processes. However, concurrent<br />
observation of mammalian behavior and underlying cellular<br />
dynamics has been a longstanding challenge. We describe a<br />
miniaturized (1.1 g mass) epifluorescence microscope for<br />
cellular-level brain imaging in freely moving mice, and its<br />
application to imaging microcirculation and neuronal<br />
Ca 2+ dynamics.<br />
Since the invention of compound optical microscopy, an ongoing<br />
pursuit has been the development of increasingly versatile intravital<br />
microscopes for observing live-cell dynamics, ideally in behaving<br />
organisms. In mammals, achieving this ideal has been elusive<br />
because of the difficulties of microscopy in active animals.<br />
Among mammalian species, the mouse is the preeminent genetic<br />
model for targeted manipulation of cellular properties. Thus,<br />
innovation of microscopes for use in active mice is particularly<br />
important because of the potential for combining genetic manipulations<br />
with cellular-level observations during mouse behavior.<br />
Prior investigations have exploited flexible fiber optics to study<br />
behaving mammals, including mice 1–3 , but these involved monitoring<br />
of bulk parameters rather than imaging 2,3 , or they involved<br />
epifluorescence 1,4 or reflectance 5 imaging at resolutions too coarse<br />
to resolve individual cells. One pioneering study demonstrated<br />
fiber-scanning two-photon microscopy in freely moving rats 6 ;<br />
however, except when the rats were still, imaging suffered from<br />
motion artifacts and did not allow measurements of cellular<br />
dynamics during active behavior. These artifacts arise owing to<br />
slow (B2 Hz) rates of frame-acquisition during fiber-scanning,<br />
movement-induced distortions to scanning patterns and brain<br />
displacements relative to the focal plane. Head-fixation of<br />
alert animals of various species reduces motion artifacts and<br />
permits use of conventional instrumentation but precludes many<br />
animal behaviors 7 (<strong>Nimmerjahn</strong>, A. et al., Society for Neuroscience<br />
abstracts, 2007).<br />
We describe an epifluorescence microscope (1.1 g mass) that can<br />
be carried by an adult mouse and allows high-speed cellular<br />
imaging (r100 Hz) during active behavior (Fig. 1a,b). Penetration<br />
depths into tissue achieved using epifluorescence microscopy are<br />
inferior to those achieved by two-photon imaging, but we reasoned<br />
that the faster frame rates, lack of scanning and greater depth of<br />
field of epifluorescence imaging would reduce motion artifacts.<br />
Epifluorescence microscopy can also address broader fields of view,<br />
as miniaturized scanners for portable two-photon imaging generally<br />
have limited range 8 . Also, some questions about deep tissues<br />
are addressable via epifluorescence microscopy by imaging the<br />
superficial dendrites of neurons with deep somata 4 or by inserting<br />
micro-optical objectives into tissue 8 .<br />
Our microscope has fiber- and micro-optics for light transmission<br />
and miniaturized gears for focusing (Fig. 1 and Supplementary<br />
Fig. 1a online). There are three microlenses, a 1-mm-diameter<br />
gradient refractive index (GRIN) objective, a 2-mm-diameter<br />
GRIN focusing lens and a 2-mm-diameter coupling lens that<br />
projects an image of the specimen onto a dense bundle of optical<br />
fibers (Fig. 1c). We designed two objective versions, a longer,<br />
needle-like objective (6.2 mm long) for imaging in deep tissues<br />
(Fig. 1a) and a shorter (1.4 mm) version for imaging in superficial<br />
tissues.<br />
Light propagates bidirectionally in the fiber bundle, which<br />
delivers illumination and transmits images (240–370 mm diameter;<br />
B2.8–3.9 mm lateral resolution;B10 mm depth of field) to a<br />
camera (Fig. 1d). To relieve torsional strain within the bundle as the<br />
mouse behaves, the bundle rotates freely within a commutator,<br />
allowing the mouse to move with little resistance. Thus, captured<br />
image sequences exhibit rotations that depend on the mouse’s<br />
actions. We used an encoder to track the bundle’s rotations<br />
(Fig. 1d). Based on the encoder data and an image-registration<br />
algorithm, we computationally realigned stable records of brain<br />
dynamics (Fig. 1e and Supplementary Fig. 1b).<br />
As an initial test we studied microcirculation in the neocortex<br />
(n ¼ 4 mice) and CA1 hippocampal area (n ¼ 8), using the short<br />
and long objective, respectively. Prior studies visualized microcirculation<br />
in these tissues in anesthetized animals of various<br />
species 9,10 . All our experiments with animals were approved by<br />
the Stanford University Administrative Panel on Laboratory Animal<br />
Care. After performing a craniotomy, affixing the microscope<br />
onto the cranium and intravascularly injecting fluorescein-dextran<br />
dye into the mice, we began imaging while the mice were anesthetized<br />
(Supplementary Methods online). Erythrocytes appeared<br />
dark against the brightly labeled blood plasma, as in prior<br />
work 9,10 . Image acquisition at rates r100 Hz permitted observations<br />
of single erythrocytes. We then allowed the mice to wake up<br />
and resume active behavior. We again performed high-speed<br />
1 James H. Clark Center for Biomedical Engineering and Sciences, 2 Howard Hughes Medical Institute, Stanford University, 318 Campus Drive, Stanford, California 94305,<br />
USA. 3 These authors contributed equally to this work. Correspondence should be addressed to M.J.S. (mschnitz@stanford.edu).<br />
RECEIV<strong>ED</strong> 18 MAY; ACCEPT<strong>ED</strong> 27 AUGUST; PUBLISH<strong>ED</strong> ONLINE 5 OCTOBER 2008; DOI:10.1038/NMETH.1256<br />
NATURE METHODS | ADVANCE ONLINE PUBLICATION | 1
BRIEF COMMUNICATIONS<br />
© 2008 Nature Publishing Group h ttp://www.nature.com/natur e method s<br />
Figure 1 | Miniaturized fluorescence microscopy<br />
for high-speed brain imaging in freely behaving<br />
mice. (a) Miniaturized fluorescence microscope.<br />
(b) Cutaway view of a computer-aided design<br />
(CAD) drawing of the microscope. (c) CAD drawing<br />
of the microscope’s optical components. An image<br />
of the specimen is projected onto the fiber bundle<br />
using three microlenses, one of which is a focusing<br />
lens. The bidirectional arrow shows the 1.1-mm<br />
movement range of this lens. A bundle of rays<br />
(blue) is shown passing through the optics on<br />
the axis. (d) Illumination and light collection<br />
pathways. Illumination from a Hg-arc lamp passes<br />
through a multi-mode fiber, reflects off a dichroic<br />
mirror and is coupled into the fiber bundle. The<br />
bundle delivers illumination to the microscope on<br />
the mouse and returns the fluorescence image, which is focused onto a high-speed camera. A commutator allows the bundle to rotate as the mouse moves. An<br />
encoder tracks these rotations for offline image stabilization. EM-CCD, electron-multiplying charge-coupled device. (e) Flow chart showing procedures for image<br />
alignment and analysis. Scale bars, 1 cm.<br />
imaging, often with the mice running vigorously. After data<br />
realignment, erythrocyte flow was readily evident (Fig. 2a). Few<br />
motion artifacts were apparent and were generally limited to<br />
o2 mm of sporadic lateral displacement (Supplementary Fig. 1c).<br />
Axial motion artifacts were normally not apparent. Thus, our<br />
device allowed physiological dynamics to be imaged at higher<br />
speeds and seemed to provide superior robustness to motion<br />
artifacts as compared to fiber-scanning two-photon microscopy 6 .<br />
Detailed analysis of microcirculation focused on a subset of data<br />
from neocortex (n ¼ 3 mice) and hippocampus (n ¼ 3mice)<br />
(Fig. 2b–j). By using temporal cross-correlation analysis (Supplementary<br />
Methods) we found broadly distributed flow speeds for<br />
capillaries (o10 mm diameter), venules and arterioles (Fig. 2b–j).<br />
For individual mice we calculated flow speed maps (Fig. 2f,i). The<br />
range of speeds we found in behaving mice lies within reported<br />
ranges from anesthetized rodents 9,10 . We also studied relationships<br />
between flow speed and vessel diameter. There were noticeable<br />
differences between mice, but larger vessels generally exhibited<br />
higher speeds in neocortex (correlation coefficient, r ¼ 0.46 ± 0.05;<br />
mean ± s.d.; n ¼ 3 mice) and hippocampus (r ¼ 0.67 ± 0.10; n ¼ 3)<br />
a<br />
Optical<br />
encoder<br />
Image<br />
acquisition<br />
Coarse<br />
alignment with<br />
encoder data<br />
Figure 2 | High-speed imaging of cerebral microcirculation in freely behaving<br />
mice. (a) Raw images of neocortical microcirculation in a behaving mouse.<br />
Arrowheads mark progress of single erythrocytes. (b) Image of neocortical<br />
vasculature, computed as the s.d. of images acquired over a 10-s interval.<br />
Red and white boxes enclose regions shown in a and c, respectively. (c) To<br />
determine vessel diameter and erythrocyte speed, images were divided into<br />
a grid and no more than one vessel was sampled per square. Yellow lines<br />
indicate cross-sectional vessel widths. Arrowhead points to where erythrocyte<br />
speed was computed in d. (d) Three cross-correlation maps of the area marked<br />
by a blue box in c computed at –30, 0 and +30 ms time delays, revealing<br />
average erythrocyte progression over 7 images acquired at 100 Hz.<br />
(e–j) Images of neocortical vasculature (e) and hippocampal vasculature (h)<br />
in an awake, freely moving mouse, obtained as in b, and maps of erythrocyte<br />
speed across the respective image (f,i). Plots of average erythrocyte speed<br />
versus vessel diameter in the neocortex (g) and hippocampus (j) ofbehaving<br />
mice. The data points in each plot were acquired from three different mice<br />
(n ¼ 6 mice analyzed in total), with the data points from each mouse<br />
uniformly colored red, blue or black. Each data point color represents a<br />
different mouse. Neocortical images acquired at 100 Hz with 3 3 pixelbinning<br />
on the camera and 450–550 mW illumination. Hippocampal images<br />
acquired at 75 Hz using 2 2binningand250–1,020mW illumination.<br />
Scale bars, 20 mm (a,d), 100 mm (b,e,h) and40mm (c).<br />
e<br />
b<br />
Fiber<br />
bundle<br />
Gear<br />
assembly<br />
Fine alignment<br />
with image<br />
registration<br />
Focusing<br />
motor<br />
Focusing<br />
lens<br />
Objective<br />
c<br />
Ca 2+ imaging<br />
∆F′/F′<br />
computation<br />
Crosscorrelation<br />
speed maps<br />
Microcirculation<br />
analysis<br />
Fiber<br />
bundle<br />
Coupling<br />
lens<br />
Focusing<br />
lens<br />
Objective<br />
Analysis<br />
of cellular<br />
signals<br />
Dichroic<br />
Fiber bundle<br />
EM-CCD<br />
camera<br />
Filters Multimode fiber<br />
Projection lens<br />
Mercury<br />
arc lamp<br />
Commutator<br />
Encoder<br />
Microscope<br />
(Fig. 2g,j). Given these findings, miniaturized microscopy should<br />
be applicable to studies of cerebrovascular diseases and interactions<br />
between brain activity, behavior and hemodynamics 10 .<br />
We next studied Ca 2+ dynamics of cerebellar Purkinje cells<br />
during active locomotor behavior. Purkinje cells’ dendritic trees<br />
lie within parasagittal planes and extend into superficial portions of<br />
the cerebellar molecular layer accessible by epifluorescence imaging.<br />
Stereotyped Ca 2+ action potentials are known to pervade the<br />
Purkinje cell dendritic tree during complex (Na + and Ca 2+ )spikes,<br />
are believed to be critical for motor coordination, are driven reliably<br />
by climbing fiber input from the inferior olive and have been<br />
visualized previously by in vivo Ca 2+ imaging 11,12 .TolabelPurkinje<br />
0 ms 60 ms 120 ms 180 ms 240 ms<br />
a<br />
b<br />
e<br />
h<br />
0<br />
0<br />
c<br />
f<br />
i<br />
d<br />
1.25<br />
Speed (mm/s)<br />
1<br />
Speed (mm/s)<br />
2.5<br />
2<br />
d<br />
g<br />
Speed (mm/s) Speed (mm/s)<br />
j<br />
30 ms<br />
3<br />
2<br />
1<br />
0 ms<br />
–30 ms<br />
0<br />
5 15<br />
Vessel diameter (µm)<br />
2<br />
1<br />
0<br />
5 9 15<br />
Vessel diameter (µm)<br />
2 | ADVANCE ONLINE PUBLICATION | NATURE METHODS
BRIEF COMMUNICATIONS<br />
© 2008 Nature Publishing Group h ttp://www.nature.com/natur e method s<br />
Figure 3 | High-speed imaging of cerebellar<br />
Purkinje cell dendritic Ca 2+ spiking. (a) Twelve<br />
dendritic tree segments identified in an<br />
unrestrained mouse sitting quietly while<br />
recovering from anesthesia. (b) Average of 8<br />
frames in which the cell colored red in a exhibited<br />
aCa 2+ spike. (c) DF/F traces averaged over the<br />
color-corresponding filled areas in a. (d) Average<br />
of 350 ms windows surrounding 20 (red) and<br />
22 (blue) Ca 2+ spikes extracted by temporal<br />
deconvolution and threshold detection from the<br />
color-corresponding traces in c. The windows were<br />
triggered to begin 90 ms before the onset of the<br />
spike. (e) Seventeen dendritic tree segments identified in a freely behaving mouse. (f) Average of 4 frames in which the cell colored blue in e exhibited a Ca 2+<br />
spike. (g) DF’/F’ averaged over the color-corresponding filled areas in e. (h) Average of 350-ms windows surrounding 37 (red) and 23 (blue) spikes from the<br />
color-corresponding traces in g. All images acquired with 3 3 binning of the camera pixels. Illumination power at the specimen was B56 mW (a–d), and<br />
B420 mW (e–h). Imaging frame rates were 62.5 Hz (a–d) and100Hz(e–h). Scale bars, 100 mm.<br />
cells with fluorescent Ca 2+ indicator, we injected membranepermeant<br />
Oregon Green-488–1,2-bis(o-aminophenoxy)ethane-<br />
N,N,N¢,N¢-tetraacetic acid–1-acetoxymethyl into the cerebellar<br />
vermis before attaching to the mouse the microscope with the<br />
shorter objective installed.<br />
While mice were anesthetized, we first characterized Ca 2+ spiking<br />
in up to tens of dendritic trees concurrently. Ca 2+ spikes appeared<br />
stereotyped, with a brief rise in fluorescence intensity, which<br />
we expressed as the percentage change relative to the baseline<br />
value (0.5–1.5% DF/F) followed by an exponential decline over<br />
B150 ms reflecting the dye’s kinetics of Ca 2+ unbinding. Spikes<br />
occurred within parallel stripe-shaped regions (B100–250 mm<br />
long, B7–11 mm wide) that were approximately aligned to the<br />
rostral-caudal axis and consistent with the breadth of Purkinje cell<br />
arborizations 12 . This striped appearance occurs because the<br />
dendrites extend perpendicular to the field of view. The striped<br />
profiles matched those we and others have observed by in vivo<br />
two-photon imaging 11 and verified by simultaneous electrophysiological<br />
recordings to represent the dendritic Ca 2+ spikes that occur<br />
during complex action potentials (<strong>Nimmerjahn</strong>, A. et al., Society<br />
for Neuroscience abstracts, 2007; Supplementary Methods).<br />
After terminating anesthesia administration we studied Ca 2+<br />
spiking during the immediate recovery of the mice and their<br />
subsequent active behavior (n ¼ 6mice)(Fig. 3 and Supplementary<br />
Fig. 2 online). To account for slight spatial heterogeneities in<br />
illumination causing variations in fluorescence intensity as the<br />
bundle rotated, we normalized the relative fluorescence traces<br />
from active mice by the mean illumination for a given bundle<br />
orientation and denoted the resultant with primes (DF¢/F¢). Ca 2+<br />
spikes were again apparent in striped domains (Fig. 3a,b,e,f),<br />
allowing spike identification by an algorithm that accounts for<br />
dye kinetics by a temporal deconvolution before application of<br />
the detection threshold (Supplementary Methods). Average spike<br />
waveforms were closely similar across anesthetized, alert and actively<br />
moving mice (Fig. 3d,h).<br />
To determine spike rates, we assessed false positive detections by<br />
analyzing signals from control regions with the same forms as<br />
Purkinje cells but orthogonal, medial-lateral orientations. These<br />
control regions yielded false positive spike rates that depended on<br />
the detection threshold (Supplementary Methods). After setting<br />
the threshold such that false positive rates were fixed at an<br />
insignificant value (0.025 Hz), we examined Ca 2+ spiking rates of<br />
a<br />
e<br />
b<br />
0.5 1.6 2.7<br />
∆F/F (%)<br />
f<br />
0.2 0.7 1.2<br />
∆F ′/F ′(%)<br />
c<br />
g<br />
1%<br />
∆F/F<br />
1.5 s<br />
Purkinje cells. Mean rates in awake mice were 0.57 ± 0.39 Hz (mean<br />
±s.d.;n ¼ 42 cells from 3 mice), within reported ranges 13 .The<br />
percentage of spikes we detected in error (2–10%) was within the<br />
error ranges (0–30%) achieved by extracellular electrophysiological<br />
recordings in various live animals 14 .<br />
We next examined whether Purkinje cells in the vermis exhibit<br />
changes in net rates of Ca 2+ spiking during active locomotion.<br />
Previous electrophysiological studies have examined this question<br />
in decerebrated cats, but the data have often been ambiguous 15 .We<br />
sorted our recordings into periods when the awake mice were active<br />
or resting by using the encoder trace as an indicator of mouse<br />
movement. We designated the periods when the mouse rotated the<br />
fiber bundle at 4200 degrees/s as movement episodes. Analysis of<br />
Ca 2+ spiking rates showed nearly all Purkinje cells exhibited<br />
moderately greater spiking during motor activity compared to<br />
rest, creating significant differences between spike rate distributions<br />
in the active and resting states (P o 10 7 ; one-sided Wilcoxon<br />
signed rank test; Fig. 4 and Supplementary Methods).<br />
We also compared correlations in Ca 2+ spiking between pairs of<br />
Purkinje cells. Prior studies in rats have reported increases in<br />
correlated Purkinje cell activity during tongue licking 16 . These<br />
studies used electrode arrays 42 mm in extent with 250mm<br />
a<br />
2.0<br />
Moving spike rate (Hz)<br />
1.5<br />
1.0<br />
0.5<br />
0<br />
0 0.5 1.0 1.5<br />
Resting spike rate (Hz)<br />
b<br />
Spike rate (Hz)<br />
0.6<br />
0.4<br />
0.2<br />
0<br />
d<br />
h<br />
0.5%<br />
∆F/F<br />
0.1 s<br />
1%<br />
∆F ′/F ′ 0.5%<br />
1.5 s<br />
∆F ′/F ′<br />
Moving<br />
Resting<br />
Correlation coefficient<br />
0.10<br />
0.05<br />
0<br />
Moving<br />
Resting<br />
0.1 s<br />
P < 10 –7 P < 10 –4<br />
0.15<br />
Figure 4 | Comparisons of Purkinje cell Ca 2+ spiking during rest and motor<br />
behavior. (a) For each of 42 cells, a comparison of Ca 2+ spiking rates during<br />
periods when the mouse was moving versus periods of rest as determined from<br />
the rotational velocity of the mouse’s head. Line demarcates equal rates under<br />
both conditions. (b) Comparisons of Ca 2+ spiking rates (mean ± s.e.m.) (left)<br />
and correlation coefficients for pairwise synchronous Ca 2+ activity (right),<br />
during periods of rest and active movement, for the 42 cells analyzed in a.<br />
Modest but significant differences existed between the two behavioral states,<br />
for spiking rates and correlation coefficients (P o 10 7 and P o 10 4 ,<br />
respectively; one-tailed Wilcoxon signed rank test).<br />
NATURE METHODS | ADVANCE ONLINE PUBLICATION | 3
BRIEF COMMUNICATIONS<br />
© 2008 Nature Publishing Group h ttp://www.nature.com/natur e method s<br />
between electrodes. Our observations are of local networks of<br />
multiple neurons within a single field 240–370 mm across. Calculation<br />
of the mean correlation coefficient across all simultaneously<br />
recorded cell pairs 16 (Supplementary Methods) revealed modest<br />
increases in correlated Ca 2+ spiking during active movement as<br />
compared to rest (P o 10 4 ; one-sided Wilcoxon signed rank test)<br />
(Fig. 4).We more frequently saw synchronous Ca 2+ activity within<br />
neighboring, but not distally separated, dendritic trees (Supplementary<br />
Fig. 2). This is consistent with the notion Purkinje cells<br />
are organized into micro-zones of correlated activity 12 .<br />
Compared to fiberoptic two-photon microscopes 6 , which offer<br />
optical sectioning and lower background fluorescence, our microscope<br />
provides broader fields of view, faster frame rates<br />
and decreased susceptibility to motion artifacts, but with the<br />
B50–100 mm depth limitations inherent to epifluorescence imaging<br />
8 . Our microscope provides superior resolution to that attained<br />
by fiber bundles used without micro-optic objectives 1 .Thislatter<br />
approach, unlike ours, has not resolved cells. The GRIN microlenses<br />
we used are similar to those used for fluorescence microendoscopy<br />
8,9 , but modified to accommodate our microscope’s<br />
focusing capability. Overall, our microscope is well suited for<br />
studying cellular processes in accessible tissues, such as the Purkinje<br />
cell Ca 2+ dynamics examined here, within actively behaving wildtype<br />
or genetically manipulated mice or other laboratory animals.<br />
Other cells that might be studied with our microscope include<br />
olfactory bulb neurons or neocortical neurons with superficial<br />
dendrites. Deeper cells might be accessed by insertion of the<br />
microscope’s longer objective into tissue. Feasible improvements<br />
include addition of a second fluorescence channel or electrodes for<br />
auxiliary electrophysiological recordings. Given the growing use of<br />
animal disease models, including many mouse models of cerebellar<br />
ataxia and Purkinje cell degeneration, miniaturized microscopy<br />
should permit studies in behaving mice of neurological, behavioral<br />
and cerebrovascular disorders.<br />
Note: Supplementary information is available on the Nature Methods website.<br />
ACKNOWL<strong>ED</strong>GMENTS<br />
Our work was supported by grants to M.J.S. from the US National Science<br />
Foundation (NSF), the Office of Naval Research, the Packard and Beckman<br />
Foundations, and the NSF Center for Biophotonics, and by research fellowships<br />
from the NSF (B.A.F., E.A.M. and L.D.B.), Stanford University (L.D.B.), the<br />
International Human Frontier Science Program Organization (A.N.) and the<br />
Stanford University–US National Institutes of Health Biotechnology (E.D.C.)<br />
and Biophysics (R.P.J.B.) training grants. We thank Stanford University’s Varian<br />
Machine Shop, D. Profitt and A. Lui for technical assistance.<br />
Published online at http://www.nature.com/naturemethods/<br />
Reprints and permissions information is available online at<br />
http://npg.nature.com/reprintsandpermissions/<br />
1. Ferezou, I., Bolea, S. & Petersen, C.C. Neuron 50, 617–629 (2006).<br />
2. Yamaguchi, S. et al. Nature 409, 684 (2001).<br />
3. Adelsberger, H., Garaschuk, O. & Konnerth, A. Nat. Neurosci. 8, 988–990<br />
(2005).<br />
4. Murayama, M., Perez-Garci, E., Luscher, H.R. & Larkum, M.E. J. Neurophysiol. 98,<br />
1791–1805 (2007).<br />
5. Poe, G.R., Kristensen, M.P., Rector, D.M. & Harper, R.M. Neuroscience 72, 39–48<br />
(1996).<br />
6. Helmchen, F., Fee, M.S., Tank, D.W. & Denk, W. Neuron 31, 903–912 (2001).<br />
7. Dombeck, D.A., Khabbaz, A.N., Collman, F., Adelman, T.L. & Tank, D.W. Neuron 56,<br />
43–57 (2007).<br />
8. <strong>Flusberg</strong>, B.A. et al. Nat. Methods 2, 941–950 (2005).<br />
9. Jung, J.C., Mehta, A.D., Aksay, E., Stepnoski, R. & Schnitzer, M.J. J. Neurophysiol.<br />
92, 3121–3133 (2004).<br />
10. Schaffer, C.B. et al. PLoS Biol. 4, e22 (2006).<br />
11. Gobel, W. & Helmchen, F. J. Neurophysiol. 98, 3770–3779 (2007).<br />
12. Llinas, R.R., Walton, K.D. & Lang, E.J. in The Synaptic Organization of the Brain.<br />
(ed., G. Shepherd), 271–310 (Oxford University Press, Oxford, 2004).<br />
13. Schiffmann, S.N. et al. Proc. Natl. Acad. Sci. USA 96, 5257–5262 (1999).<br />
14. Harris, K.D., Henze, D.A., Csicsvari, J., Hirase, H. & Buzsaki, G. J. Neurophysiol.<br />
84, 401–414 (2000).<br />
15. Andersson, G. & Armstrong, D.M. J. Physiol. (Lond.) 385, 107–134<br />
(1987).<br />
16. Welsh, J.P., Lang, E.J., Suglhara, I. & Llinas, R. Nature 374, 453–457<br />
(1995).<br />
4 | ADVANCE ONLINE PUBLICATION | NATURE METHODS