
Create successful ePaper yourself
Turn your PDF publications into a flip-book with our unique Google optimized e-Paper software.
6 Journal of Language and Social Psychology<br />
90<br />
80<br />
80.3<br />
70<br />
Frequency (%)<br />
60<br />
50<br />
40<br />
30<br />
20<br />
10<br />
0<br />
36.6<br />
24.5<br />
20.9<br />
14.1<br />
8.6<br />
White Lies<br />
Big Lies<br />
2.3<br />
3.8 3.7<br />
1.2 1.0 0.3 1.3 0.2 0.1 0.1 0.1 0.1 0.5 0.4<br />
0 1 2 3 4 5 10 15 20 25<br />
Number of Lies/Day<br />
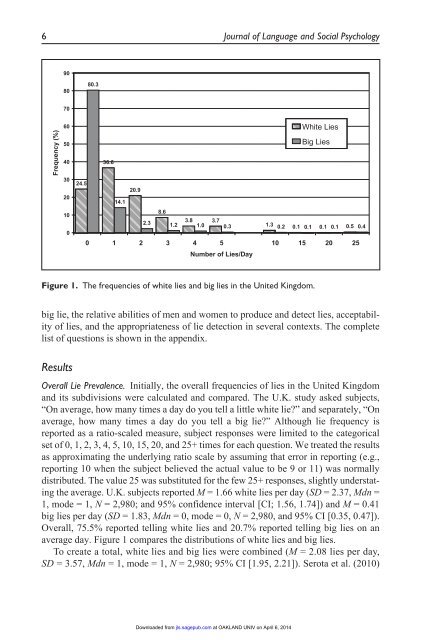
Figure 1. The frequencies of white lies and big lies in the United Kingdom.<br />
big lie, the relative abilities of men and women to produce and detect lies, acceptability<br />
of lies, and the appropriateness of lie detection in several contexts. The complete<br />
list of questions is shown in the appendix.<br />
Results<br />
Overall Lie Prevalence. Initially, the overall frequencies of lies in the United Kingdom<br />
and its subdivisions were calculated and compared. The U.K. study asked subjects,<br />
“On average, how many times a day do you tell a little white lie” and separately, “On<br />
average, how many times a day do you tell a big lie” Although lie frequency is<br />
reported as a ratio-scaled measure, subject responses were limited to the categorical<br />
set of 0, 1, 2, 3, 4, 5, 10, 15, 20, and 25+ times for each question. We treated the results<br />
as approximating the underlying ratio scale by assuming that error in reporting (e.g.,<br />
reporting 10 when the subject believed the actual value to be 9 or 11) was normally<br />
distributed. The value 25 was substituted for the few 25+ responses, slightly understating<br />
the average. U.K. subjects reported M = 1.66 white lies per day (SD = 2.37, Mdn =<br />
1, mode = 1, N = 2,980; and 95% confidence interval [CI; 1.56, 1.74]) and M = 0.41<br />
big lies per day (SD = 1.83, Mdn = 0, mode = 0, N = 2,980, and 95% CI [0.35, 0.47]).<br />
Overall, 75.5% reported telling white lies and 20.7% reported telling big lies on an<br />
average day. Figure 1 compares the distributions of white lies and big lies.<br />
To create a total, white lies and big lies were combined (M = 2.08 lies per day,<br />
SD = 3.57, Mdn = 1, mode = 1, N = 2,980; 95% CI [1.95, 2.21]). <strong>Serota</strong> et al. (2010)<br />
Downloaded from jls.sagepub.com at OAKLAND UNIV on April 6, <strong>2014</strong>