Grade Level Content Expectations - State of Michigan
Grade Level Content Expectations - State of Michigan
Grade Level Content Expectations - State of Michigan

You also want an ePaper? Increase the reach of your titles
YUMPU automatically turns print PDFs into web optimized ePapers that Google loves.
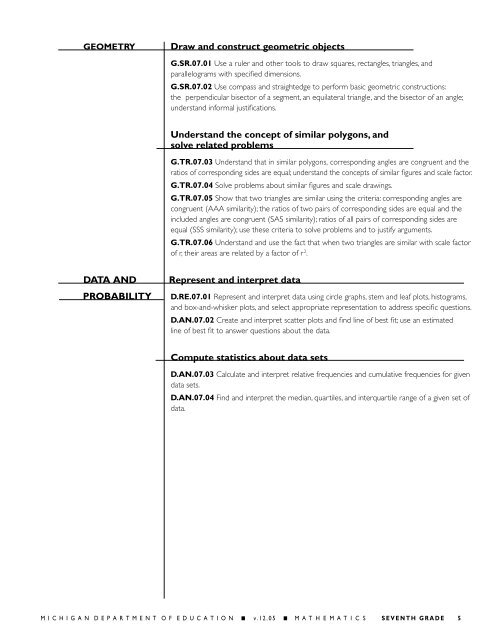
GEOMETRY<br />
Draw and construct geometric objects<br />
G.SR.07.01 Use a ruler and other tools to draw squares, rectangles, triangles, and<br />
parallelograms with specified dimensions.<br />
G.SR.07.02 Use compass and straightedge to perform basic geometric constructions:<br />
the perpendicular bisector <strong>of</strong> a segment, an equilateral triangle, and the bisector <strong>of</strong> an angle;<br />
understand informal justifications.<br />
Understand the concept <strong>of</strong> similar polygons, and<br />
solve related problems<br />
G.TR.07.03 Understand that in similar polygons, corresponding angles are congruent and the<br />
ratios <strong>of</strong> corresponding sides are equal; understand the concepts <strong>of</strong> similar figures and scale factor.<br />
G.TR.07.04 Solve problems about similar figures and scale drawings.<br />
G.TR.07.05 Show that two triangles are similar using the criteria: corresponding angles are<br />
congruent (AAA similarity); the ratios <strong>of</strong> two pairs <strong>of</strong> corresponding sides are equal and the<br />
included angles are congruent (SAS similarity); ratios <strong>of</strong> all pairs <strong>of</strong> corresponding sides are<br />
equal (SSS similarity); use these criteria to solve problems and to justify arguments.<br />
G.TR.07.06 Understand and use the fact that when two triangles are similar with scale factor<br />
<strong>of</strong> r, their areas are related by a factor <strong>of</strong> r 2 .<br />
DATA AND<br />
PROBABILITY<br />
Represent and interpret data<br />
D.RE.07.01 Represent and interpret data using circle graphs, stem and leaf plots, histograms,<br />
and box-and-whisker plots, and select appropriate representation to address specific questions.<br />
D.AN.07.02 Create and interpret scatter plots and find line <strong>of</strong> best fit; use an estimated<br />
line <strong>of</strong> best fit to answer questions about the data.<br />
Compute statistics about data sets<br />
D.AN.07.03 Calculate and interpret relative frequencies and cumulative frequencies for given<br />
data sets.<br />
D.AN.07.04 Find and interpret the median, quartiles, and interquartile range <strong>of</strong> a given set <strong>of</strong><br />
data.<br />
M I C H I G A N D E P A R T M E N T O F E D U C A T I O N ■ v. 1 2 . 0 5 ■ M A T H E M A T I C S S E V E N T H G R A D E 5