the colorado mile markers: recommendations for measuring ...
the colorado mile markers: recommendations for measuring ...
the colorado mile markers: recommendations for measuring ...
You also want an ePaper? Increase the reach of your titles
YUMPU automatically turns print PDFs into web optimized ePapers that Google loves.
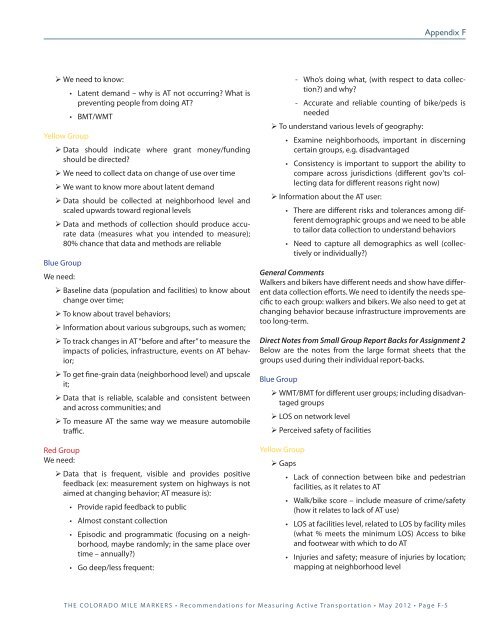
Appendix F<br />
‣ ¾We need to know:<br />
Yellow Group<br />
• Latent demand – why is AT not occurring What is<br />
preventing people from doing AT<br />
• BMT/WMT<br />
‣ ¾Data should indicate where grant money/funding<br />
should be directed<br />
‣ ¾We need to collect data on change of use over time<br />
‣ ¾We want to know more about latent demand<br />
‣ ¾Data should be collected at neighborhood level and<br />
scaled upwards toward regional levels<br />
‣ ¾Data and methods of collection should produce accurate<br />
data (measures what you intended to measure);<br />
80% chance that data and methods are reliable<br />
Blue Group<br />
We need:<br />
‣ ¾Baseline data (population and facilities) to know about<br />
change over time;<br />
‣ ¾To know about travel behaviors;<br />
‣ ¾In<strong>for</strong>mation about various subgroups, such as women;<br />
‣ ¾To track changes in AT “be<strong>for</strong>e and after” to measure <strong>the</strong><br />
impacts of policies, infrastructure, events on AT behavior;<br />
‣ ¾To get fine-grain data (neighborhood level) and upscale<br />
it;<br />
‣ ¾Data that is reliable, scalable and consistent between<br />
and across communities; and<br />
‣ ¾To measure AT <strong>the</strong> same way we measure automobile<br />
traffic.<br />
Red Group<br />
We need:<br />
‣ ¾Data that is frequent, visible and provides positive<br />
feedback (ex: measurement system on highways is not<br />
aimed at changing behavior; AT measure is):<br />
• Provide rapid feedback to public<br />
• Almost constant collection<br />
• Episodic and programmatic (focusing on a neighborhood,<br />
maybe randomly; in <strong>the</strong> same place over<br />
time – annually)<br />
• Go deep/less frequent:<br />
‐‐<br />
Who’s doing what, (with respect to data collection)<br />
and why<br />
‐‐<br />
Accurate and reliable counting of bike/peds is<br />
needed<br />
‣ ¾To understand various levels of geography:<br />
• Examine neighborhoods, important in discerning<br />
certain groups, e.g. disadvantaged<br />
• Consistency is important to support <strong>the</strong> ability to<br />
compare across jurisdictions (different gov’ts collecting<br />
data <strong>for</strong> different reasons right now)<br />
‣ ¾In<strong>for</strong>mation about <strong>the</strong> AT user:<br />
• There are different risks and tolerances among different<br />
demographic groups and we need to be able<br />
to tailor data collection to understand behaviors<br />
• Need to capture all demographics as well (collectively<br />
or individually)<br />
General Comments<br />
Walkers and bikers have different needs and show have different<br />
data collection ef<strong>for</strong>ts. We need to identify <strong>the</strong> needs specific<br />
to each group: walkers and bikers. We also need to get at<br />
changing behavior because infrastructure improvements are<br />
too long-term.<br />
Direct Notes from Small Group Report Backs <strong>for</strong> Assignment 2<br />
Below are <strong>the</strong> notes from <strong>the</strong> large <strong>for</strong>mat sheets that <strong>the</strong><br />
groups used during <strong>the</strong>ir individual report-backs.<br />
Blue Group<br />
‣ ¾WMT/BMT <strong>for</strong> different user groups; including disadvantaged<br />
groups<br />
‣ ¾los on network level<br />
‣ ¾Perceived safety of facilities<br />
Yellow Group<br />
‣ ¾Gaps<br />
• Lack of connection between bike and pedestrian<br />
facilities, as it relates to AT<br />
• Walk/bike score – include measure of crime/safety<br />
(how it relates to lack of AT use)<br />
• LOS at facilities level, related to LOS by facility <strong>mile</strong>s<br />
(what % meets <strong>the</strong> minimum LOS) Access to bike<br />
and footwear with which to do AT<br />
• Injuries and safety; measure of injuries by location;<br />
mapping at neighborhood level<br />
The Colorado Mile Markers • Recommendations <strong>for</strong> Measuring Active Transportation • May 2012 • Page F-5


