factors affecting job satisfaction in banking sector - 3rd SAICON 2011
factors affecting job satisfaction in banking sector - 3rd SAICON 2011
factors affecting job satisfaction in banking sector - 3rd SAICON 2011

Create successful ePaper yourself
Turn your PDF publications into a flip-book with our unique Google optimized e-Paper software.
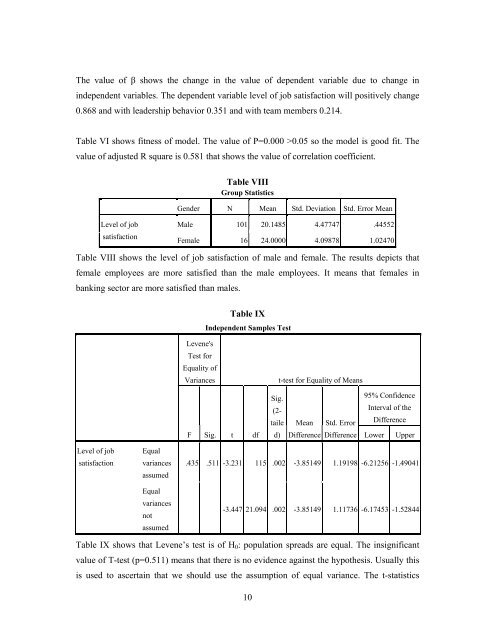
The value of β shows the change <strong>in</strong> the value of dependent variable due to change <strong>in</strong><br />
<strong>in</strong>dependent variables. The dependent variable level of <strong>job</strong> <strong>satisfaction</strong> will positively change<br />
0.868 and with leadership behavior 0.351 and with team members 0.214.<br />
Table VI shows fitness of model. The value of P=0.000 >0.05 so the model is good fit. The<br />
value of adjusted R square is 0.581 that shows the value of correlation coefficient.<br />
Table VIII<br />
Group Statistics<br />
Gender N Mean Std. Deviation Std. Error Mean<br />
Level of <strong>job</strong><br />
<strong>satisfaction</strong><br />
Male 101 20.1485 4.47747 .44552<br />
Female 16 24.0000 4.09878 1.02470<br />
Table VIII shows the level of <strong>job</strong> <strong>satisfaction</strong> of male and female. The results depicts that<br />
female employees are more satisfied than the male employees. It means that females <strong>in</strong><br />
bank<strong>in</strong>g <strong>sector</strong> are more satisfied than males.<br />
Table IX<br />
Independent Samples Test<br />
Levene's<br />
Test for<br />
Equality of<br />
Variances<br />
t-test for Equality of Means<br />
F Sig. t df<br />
Sig.<br />
(2-<br />
taile<br />
d)<br />
Mean<br />
Difference<br />
Std. Error<br />
Difference<br />
95% Confidence<br />
Interval of the<br />
Difference<br />
Lower Upper<br />
Level of <strong>job</strong><br />
<strong>satisfaction</strong><br />
Equal<br />
variances<br />
assumed<br />
Equal<br />
variances<br />
not<br />
assumed<br />
.435 .511 -3.231 115 .002 -3.85149 1.19198 -6.21256 -1.49041<br />
-3.447 21.094 .002 -3.85149 1.11736 -6.17453 -1.52844<br />
Table IX shows that Levene’s test is of H 0 : population spreads are equal. The <strong>in</strong>significant<br />
value of T-test (p=0.511) means that there is no evidence aga<strong>in</strong>st the hypothesis. Usually this<br />
is used to ascerta<strong>in</strong> that we should use the assumption of equal variance. The t-statistics<br />
10