influence-of-celebrity-endorsement-of-advertisement-on-students-purchase-intention-2165-7912.1000152
influence-of-celebrity-endorsement-of-advertisement-on-students-purchase-intention-2165-7912.1000152
influence-of-celebrity-endorsement-of-advertisement-on-students-purchase-intention-2165-7912.1000152

Create successful ePaper yourself
Turn your PDF publications into a flip-book with our unique Google optimized e-Paper software.
Citati<strong>on</strong>: Apejoye A (2013) Influence <str<strong>on</strong>g>of</str<strong>on</strong>g> Celebrity Endorsement <str<strong>on</strong>g>of</str<strong>on</strong>g> Advertisement <strong>on</strong> Students’ Purchase Intenti<strong>on</strong>. J Mass Communicat Journalism 3:<br />
152. doi:10.4172/<strong>2165</strong>-<strong>7912.1000152</strong><br />
Page 4 <str<strong>on</strong>g>of</str<strong>on</strong>g> 7<br />
selected was <strong>on</strong>e thousand and two hundred. The populati<strong>on</strong> for mass<br />
communicati<strong>on</strong> department is two hundred and fifty (250), accounting<br />
department is four hundred (400), Science laboratory department is <strong>on</strong>e<br />
hundred and twenty (120) while business administrati<strong>on</strong> department<br />
has a populati<strong>on</strong> <str<strong>on</strong>g>of</str<strong>on</strong>g> Four hundred and thirty (430). To make the<br />
sampling selecti<strong>on</strong> scientific, the researcher employed systematic<br />
sampling method to draw the <strong>on</strong>e hundred and twenty (120) sample<br />
size as according to Ogbuoshi [40], “systematic sampling method is to<br />
be applied <strong>on</strong>ly if the given populati<strong>on</strong> is logically homogenous.” Using<br />
the formula below, every 10 th number in the sampling frame is included<br />
in the sample size.<br />
k= N/n<br />
Where k=Sampling interval<br />
N= Populati<strong>on</strong> size<br />
n=Sample size<br />
where N=1200<br />
and n=120<br />
Therefore 1200/120=10<br />
Therefore k=10.<br />
Test <str<strong>on</strong>g>of</str<strong>on</strong>g> hypotheses<br />
H1: Celebrity endorsed <str<strong>on</strong>g>advertisement</str<strong>on</strong>g> does not significantly<br />
impact <strong>on</strong> buyers <strong>purchase</strong> intent.<br />
A <strong>on</strong>e pair sample test was run for experimental and c<strong>on</strong>trolled<br />
group and the result for each group is shown below Tables 1a-1d:<br />
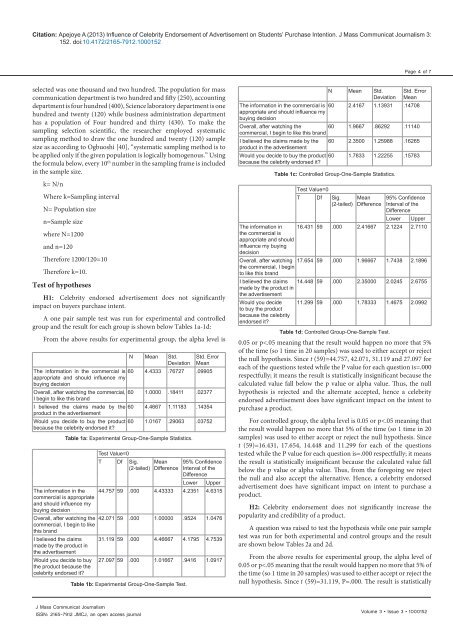
From the above results for experimental group, the alpha level is<br />
N Mean Std.<br />
Deviati<strong>on</strong><br />
Std. Error<br />
Mean<br />
The informati<strong>on</strong> in the commercial is 60 4.4333 .76727 .09905<br />
appropriate and should <str<strong>on</strong>g>influence</str<strong>on</strong>g> my<br />
buying decisi<strong>on</strong><br />
Overall, after watching the commercial, 60 1.0000 .18411 .02377<br />
I begin to like this brand<br />
I believed the claims made by the 60 4.4667 1.11183 .14354<br />
product in the <str<strong>on</strong>g>advertisement</str<strong>on</strong>g><br />
Would you decide to buy the product 60 1.0167 .29063 .03752<br />
because the <str<strong>on</strong>g>celebrity</str<strong>on</strong>g> endorsed it<br />
The informati<strong>on</strong> in the<br />
commercial is appropriate<br />
and should <str<strong>on</strong>g>influence</str<strong>on</strong>g> my<br />
buying decisi<strong>on</strong><br />
Table 1a: Experimental Group-One-Sample Statistics.<br />
Test Value=0<br />
T Df Sig.<br />
(2-tailed)<br />
Mean<br />
Difference<br />
95% C<strong>on</strong>fidence<br />
Interval <str<strong>on</strong>g>of</str<strong>on</strong>g> the<br />
Difference<br />
Lower Upper<br />
44.757 59 .000 4.43333 4.2351 4.6315<br />
Overall, after watching the 42.071 59 .000 1.00000 .9524 1.0476<br />
commercial, I begin to like<br />
this brand<br />
I believed the claims 31.119 59 .000 4.46667 4.1795 4.7539<br />
made by the product in<br />
the <str<strong>on</strong>g>advertisement</str<strong>on</strong>g><br />
Would you decide to buy<br />
the product because the<br />
<str<strong>on</strong>g>celebrity</str<strong>on</strong>g> endorsed it<br />
27.097 59 .000 1.01667 .9416 1.0917<br />
Table 1b: Experimental Group-One-Sample Test.<br />
N Mean Std.<br />
Deviati<strong>on</strong><br />
Std. Error<br />
Mean<br />
The informati<strong>on</strong> in the commercial is 60 2.4167 1.13931 .14708<br />
appropriate and should <str<strong>on</strong>g>influence</str<strong>on</strong>g> my<br />
buying decisi<strong>on</strong><br />
Overall, after watching the<br />
60 1.9667 .86292 .11140<br />
commercial, I begin to like this brand<br />
I believed the claims made by the 60 2.3500 1.25988 .16265<br />
product in the <str<strong>on</strong>g>advertisement</str<strong>on</strong>g><br />
Would you decide to buy the product 60 1.7833 1.22255 .15783<br />
because the <str<strong>on</strong>g>celebrity</str<strong>on</strong>g> endorsed it<br />
Table 1c: C<strong>on</strong>trolled Group-One-Sample Statistics.<br />
Test Value=0<br />
T Df Sig.<br />
(2-tailed)<br />
Mean<br />
Difference<br />
95% C<strong>on</strong>fidence<br />
Interval <str<strong>on</strong>g>of</str<strong>on</strong>g> the<br />
Difference<br />
Lower Upper<br />
The informati<strong>on</strong> in 16.431 59 .000 2.41667 2.1224 2.7110<br />
the commercial is<br />
appropriate and should<br />
<str<strong>on</strong>g>influence</str<strong>on</strong>g> my buying<br />
decisi<strong>on</strong><br />
Overall, after watching 17.654 59 .000 1.96667 1.7438 2.1896<br />
the commercial, I begin<br />
to like this brand<br />
I believed the claims 14.448 59 .000 2.35000 2.0245 2.6755<br />
made by the product in<br />
the <str<strong>on</strong>g>advertisement</str<strong>on</strong>g><br />
Would you decide 11.299 59 .000 1.78333 1.4675 2.0992<br />
to buy the product<br />
because the <str<strong>on</strong>g>celebrity</str<strong>on</strong>g><br />
endorsed it<br />
Table 1d: C<strong>on</strong>trolled Group-One-Sample Test.<br />
0.05 or p