workingpaper41 - Refugee and Migratory Movements Research Unit
workingpaper41 - Refugee and Migratory Movements Research Unit
workingpaper41 - Refugee and Migratory Movements Research Unit
You also want an ePaper? Increase the reach of your titles
YUMPU automatically turns print PDFs into web optimized ePapers that Google loves.
of associational migration has gone up in recent years. These issues require detailed<br />
exploration.<br />
At the same time, however, both the census <strong>and</strong> the NSS show migration for economic reasons<br />
has gone up in recent years, <strong>and</strong> rural‐urban as well as total urban economic migration has also<br />
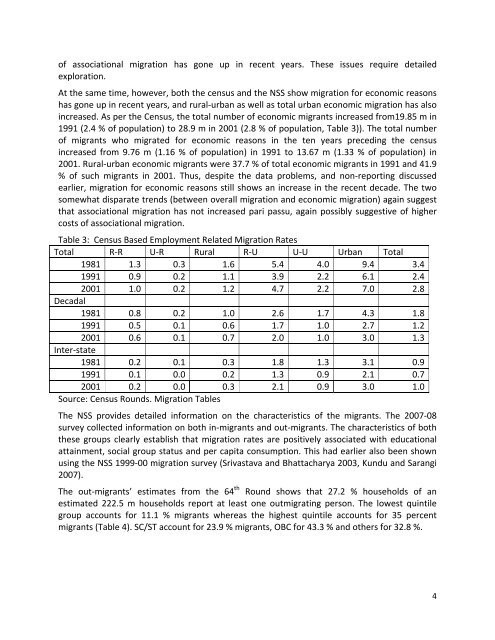
increased. As per the Census, the total number of economic migrants increased from19.85 m in<br />
1991 (2.4 % of population) to 28.9 m in 2001 (2.8 % of population, Table 3)). The total number<br />
of migrants who migrated for economic reasons in the ten years preceding the census<br />
increased from 9.76 m (1.16 % of population) in 1991 to 13.67 m (1.33 % of population) in<br />
2001. Rural‐urban economic migrants were 37.7 % of total economic migrants in 1991 <strong>and</strong> 41.9<br />
% of such migrants in 2001. Thus, despite the data problems, <strong>and</strong> non‐reporting discussed<br />
earlier, migration for economic reasons still shows an increase in the recent decade. The two<br />
somewhat disparate trends (between overall migration <strong>and</strong> economic migration) again suggest<br />
that associational migration has not increased pari passu, again possibly suggestive of higher<br />
costs of associational migration.<br />
Table 3: Census Based Employment Related Migration Rates<br />
Total R‐R U‐R Rural R‐U U‐U Urban Total<br />
1981 1.3 0.3 1.6 5.4 4.0 9.4 3.4<br />
1991 0.9 0.2 1.1 3.9 2.2 6.1 2.4<br />
2001 1.0 0.2 1.2 4.7 2.2 7.0 2.8<br />
Decadal<br />
1981 0.8 0.2 1.0 2.6 1.7 4.3 1.8<br />
1991 0.5 0.1 0.6 1.7 1.0 2.7 1.2<br />
2001 0.6 0.1 0.7 2.0 1.0 3.0 1.3<br />
Inter‐state<br />
1981 0.2 0.1 0.3 1.8 1.3 3.1 0.9<br />
1991 0.1 0.0 0.2 1.3 0.9 2.1 0.7<br />
2001 0.2 0.0 0.3 2.1 0.9 3.0 1.0<br />
Source: Census Rounds. Migration Tables<br />
The NSS provides detailed information on the characteristics of the migrants. The 2007‐08<br />
survey collected information on both in‐migrants <strong>and</strong> out‐migrants. The characteristics of both<br />
these groups clearly establish that migration rates are positively associated with educational<br />
attainment, social group status <strong>and</strong> per capita consumption. This had earlier also been shown<br />
using the NSS 1999‐00 migration survey (Srivastava <strong>and</strong> Bhattacharya 2003, Kundu <strong>and</strong> Sarangi<br />
2007).<br />
The out‐migrants’ estimates from the 64 th Round shows that 27.2 % households of an<br />
estimated 222.5 m households report at least one outmigrating person. The lowest quintile<br />
group accounts for 11.1 % migrants whereas the highest quintile accounts for 35 percent<br />
migrants (Table 4). SC/ST account for 23.9 % migrants, OBC for 43.3 % <strong>and</strong> others for 32.8 %.<br />
4


